Lab experiment is the term we use in this course for making use of the prototype through test and analysis. In this Lab experiment, we will explore the data that is automatically generated from your Raspberry Pi. We will have the first taste of data exploration and use these insights to infer how the system works.
- Step 1 Teamwork
- Task 1.3 Reporting a Lab Experiment
- Step 2: Identifying the IoT’s Technology Stack
- Step 3: Logs
- Step 4: Data Visualisation
Step 1 Teamwork
From the matchmaking event of the first coaching session, you should now be part of a team. Make sure that you have a private channel including the member of your team, your coach and the course coordinator.
Throughout the course, you will use GitHub as a platform to share your assignment code with the team and report on lab experiments.
Note: Keep in mind that during the coaching sessions you will receive feedback only based on what you share on this repository.
Task 1.1 GitHub invitation
Use the GitHub invitation link shared by the course coordinator to create your repository. You will be prompt for the name of your team. If you are the first of your team, enter a new team. Otherwise, make sure you enter the same name as your teammates.
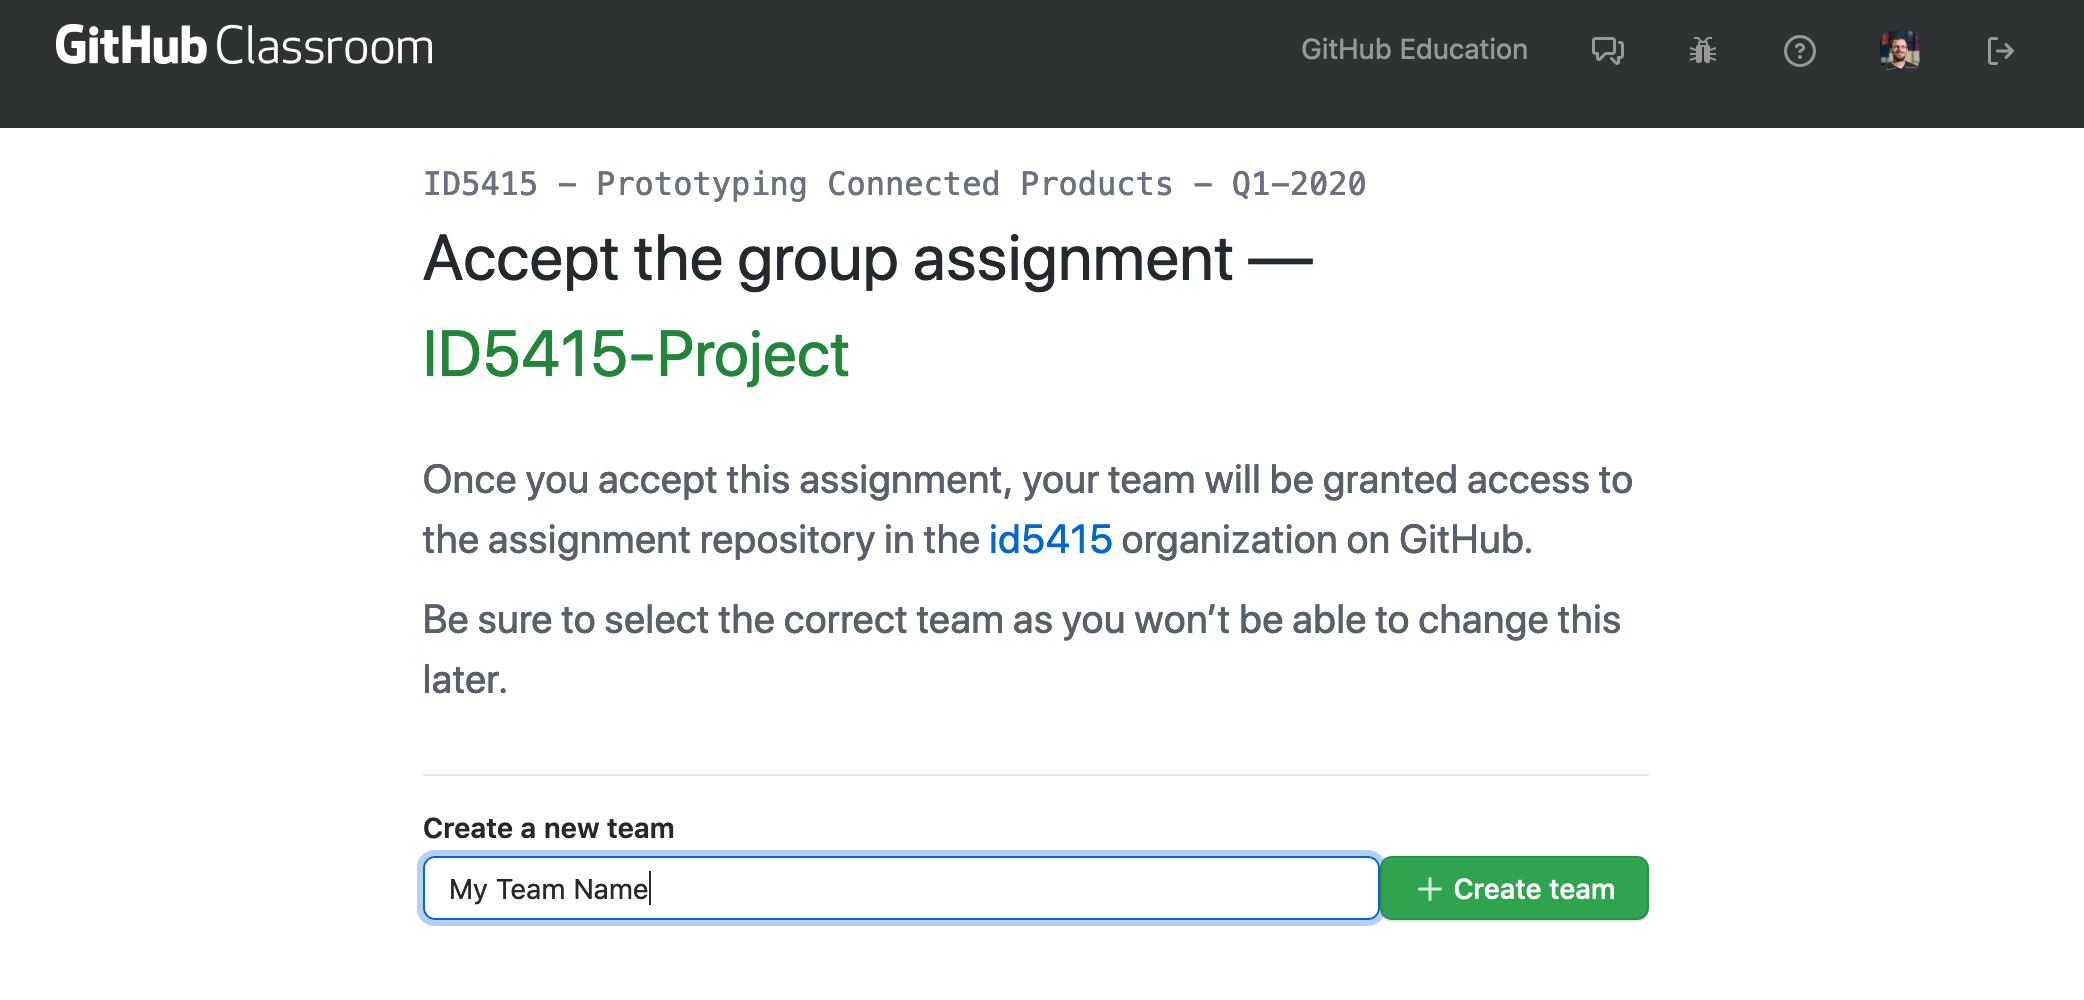
Then, you get to click on the link of your newly created repository.
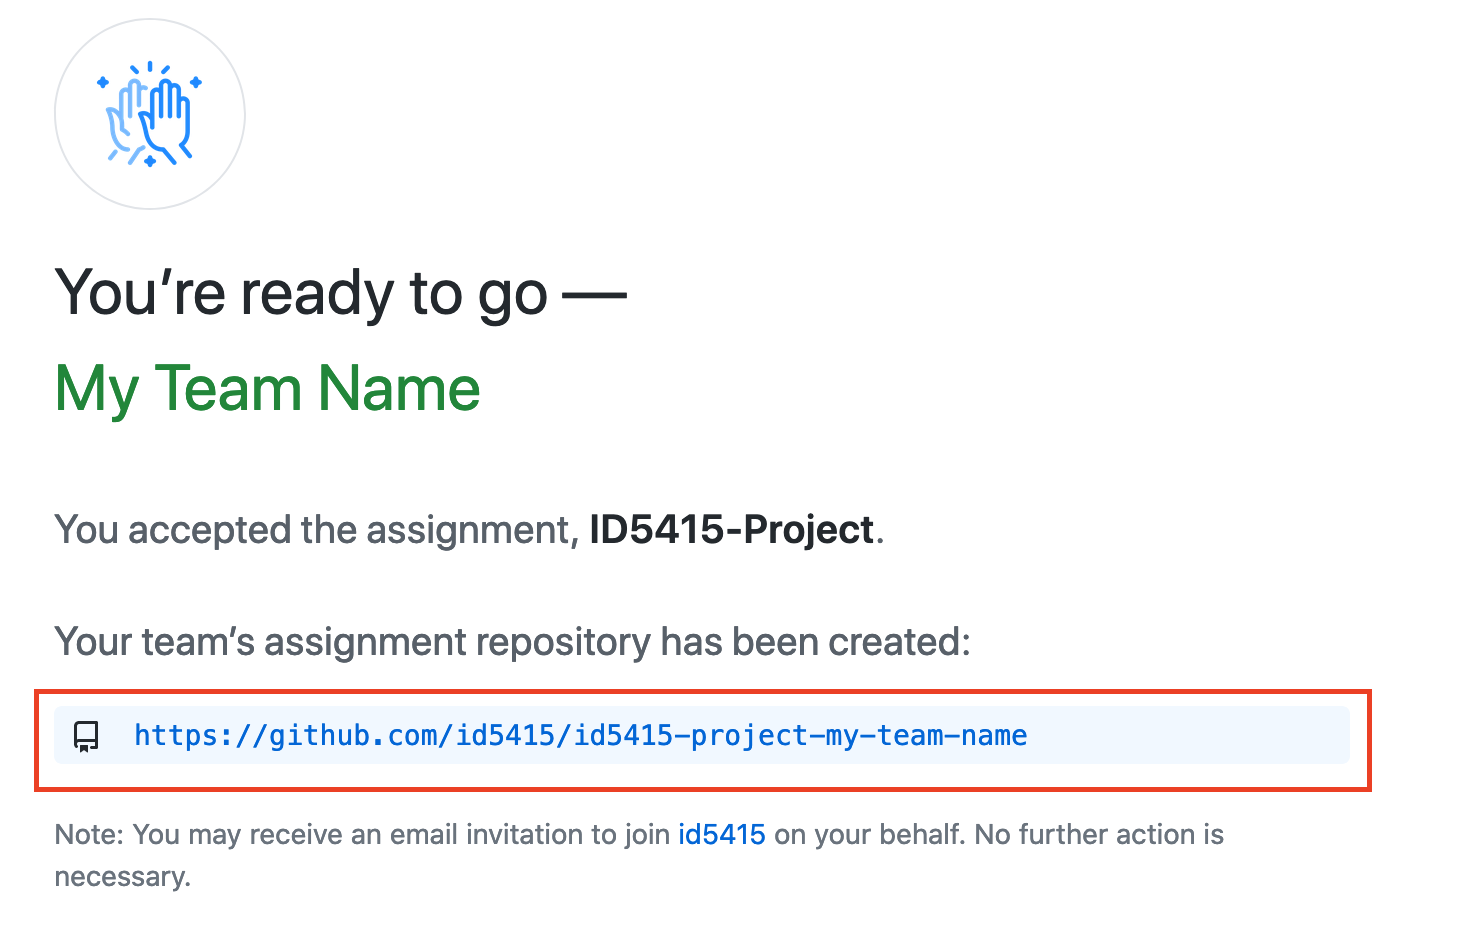
Once you accept your GitHub assignment, this is how it looks like:
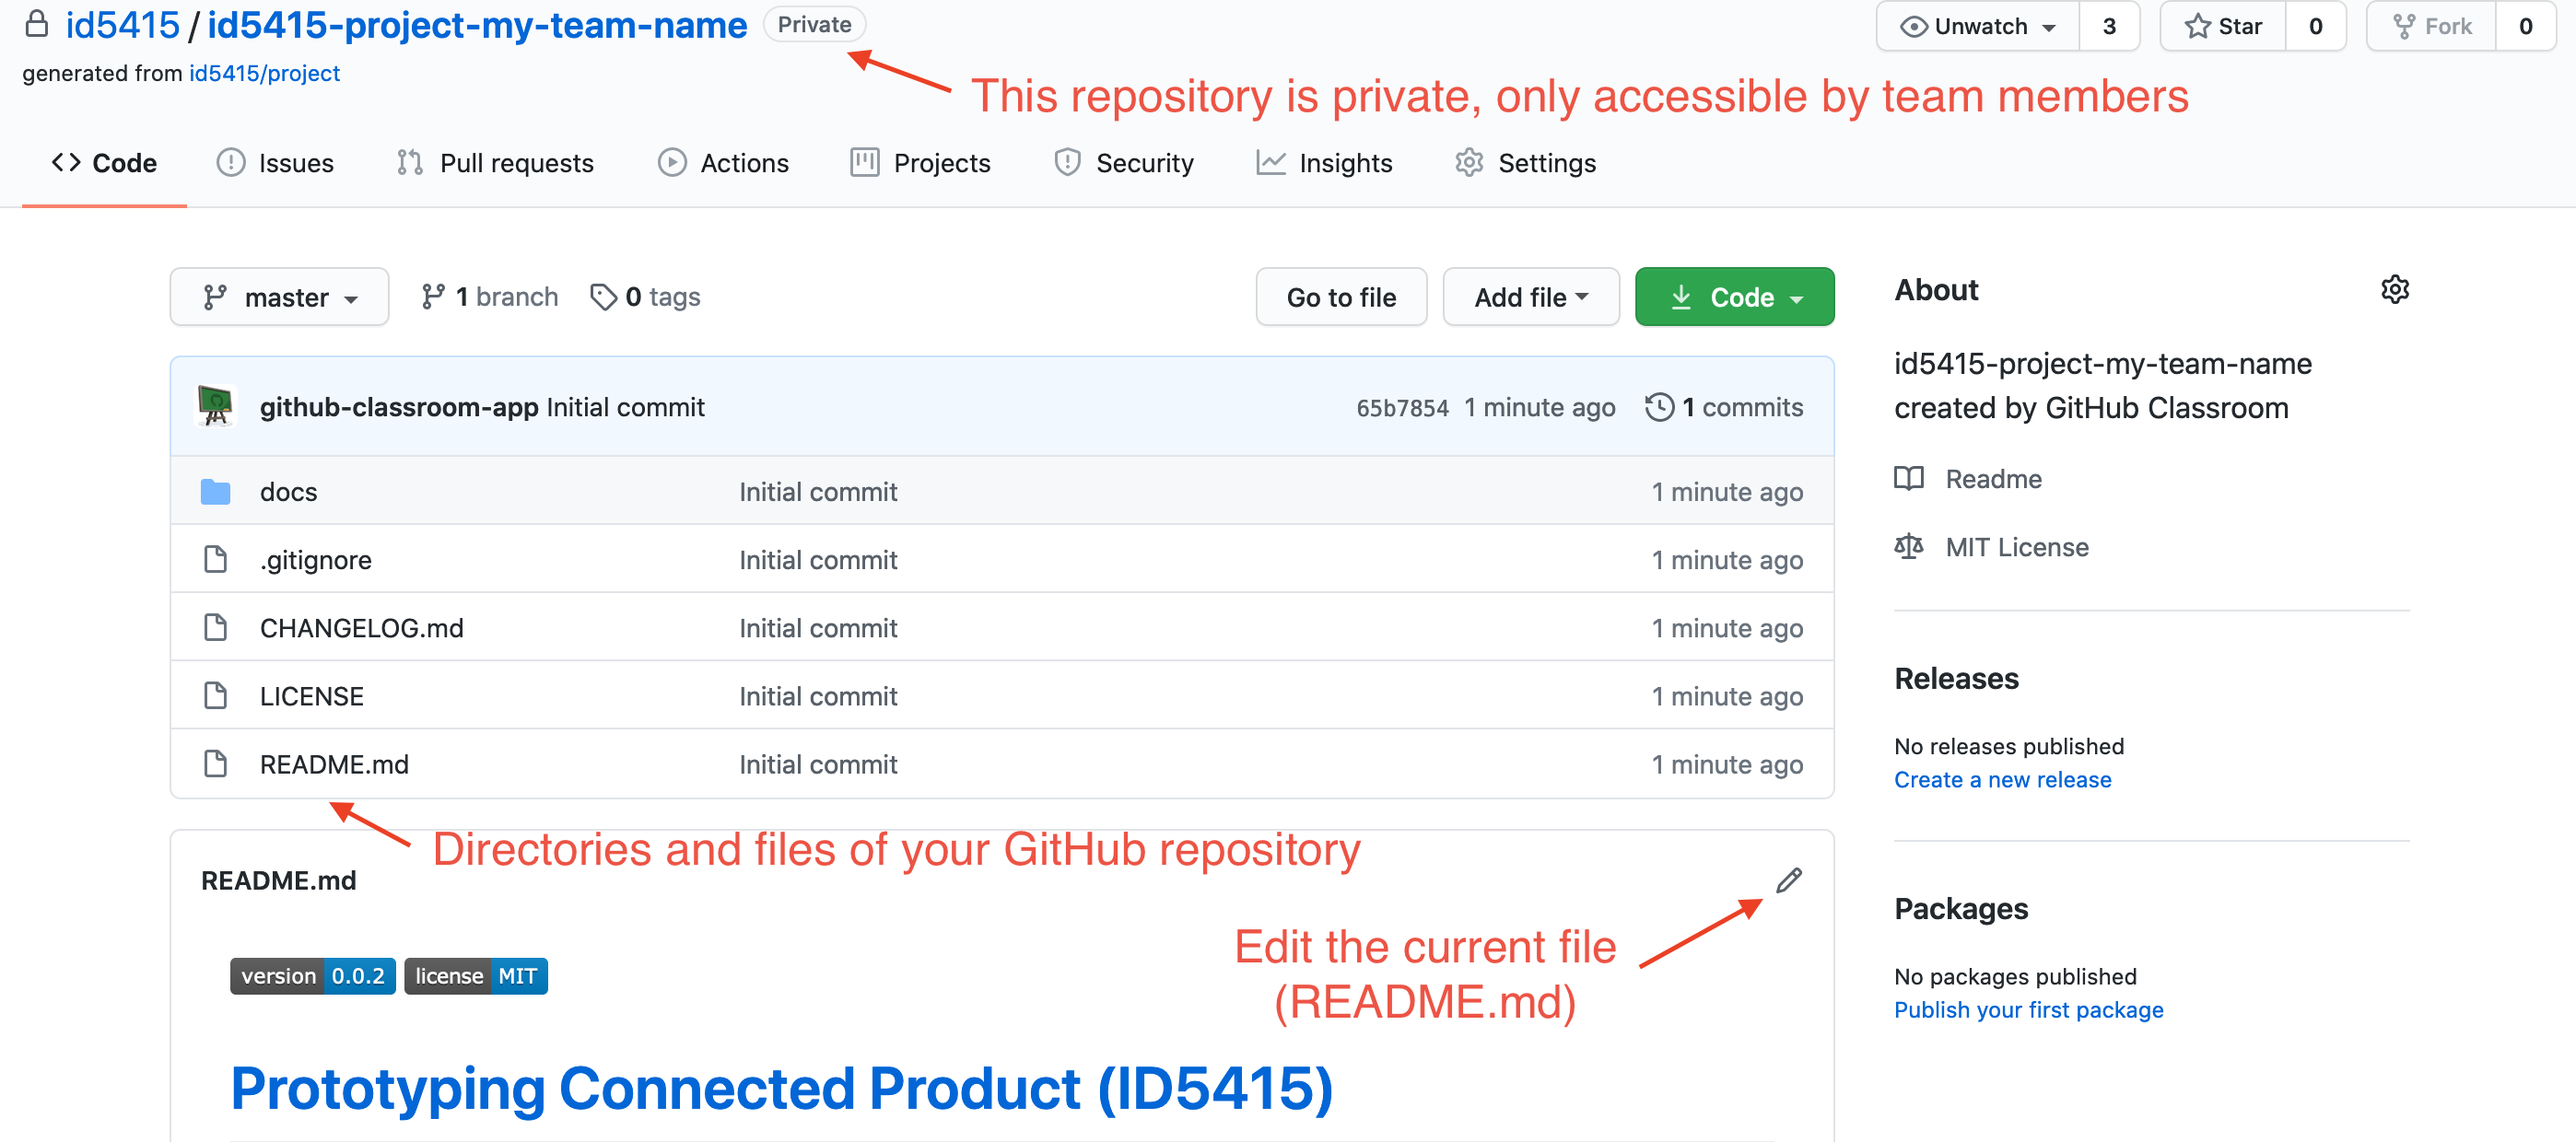
- docs: this directory will contain the documentation of your prototype and the report of your lab experiments
- .gitignore: a list of files you do not want to share on GitHub (settings specific to your machine, passwords, data, logs)
- CHANGELOG.md: significant changes you have made to your repository, for each version. At the end of each assignment, we will prompt you to fill in this file.
- LICENSE: all content on the web should have a license, otherwise no one can do anything with it (legally). Here we share the initial repository under MIT License.
- README.md: Explanation about the repository and links to the documentation and further information.
Task 1.2 Markdown
Markdown is a markup language to quickly format text. This is the language used throughout the developer community to format code documentation. In this course, you will use Markdown to report on assignments and lab experiments. Let’s walk through the basics.
On GitHub, edit the README.md (.md for MarkDown).
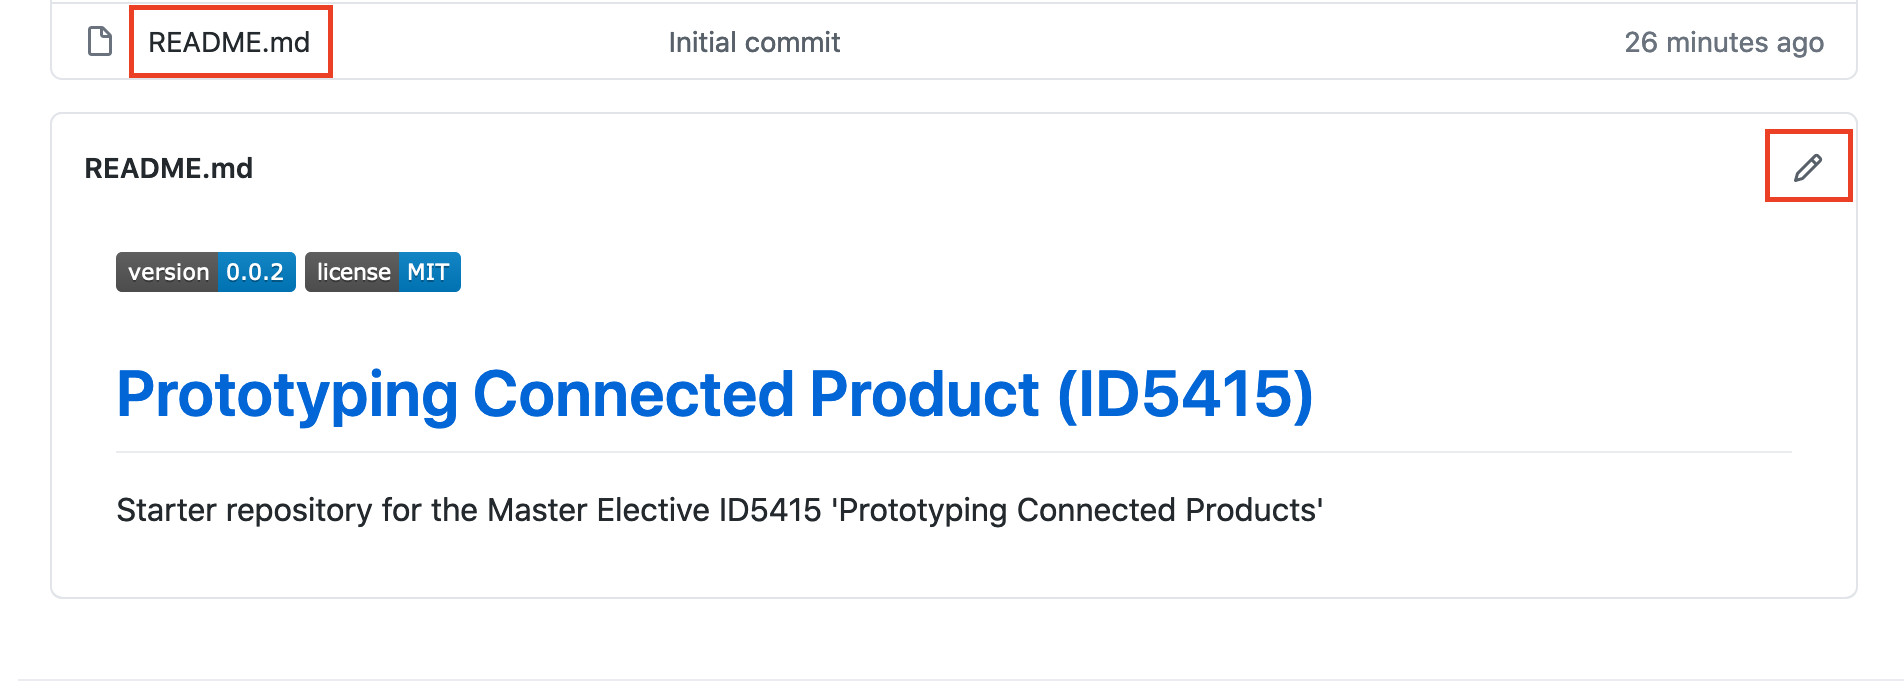
The README.md file is the first document to show up when reaching your repository. Let’s give it a personalised touch. Hash # signs are used for headers. Create a contributors’ section and list the name and 1-sentence bio of your team members.
# Contributors

- John, ...
- Yu, ...
- Els, ...
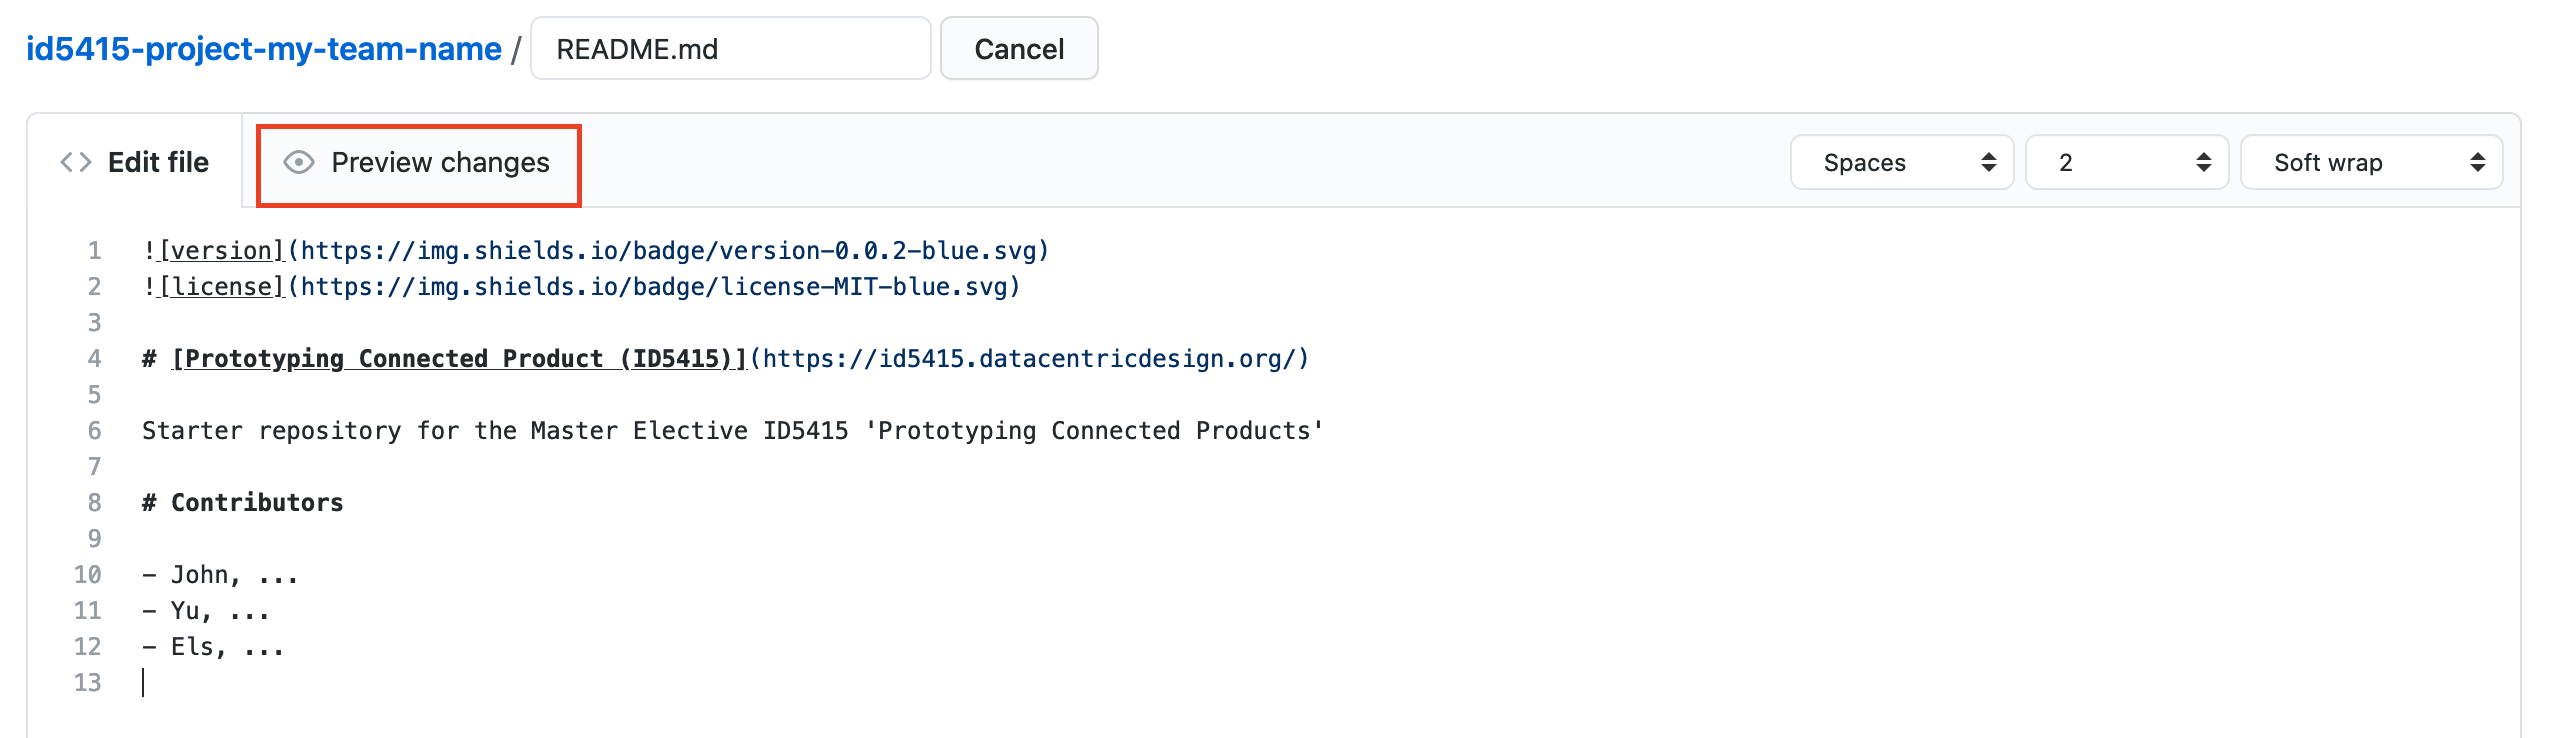
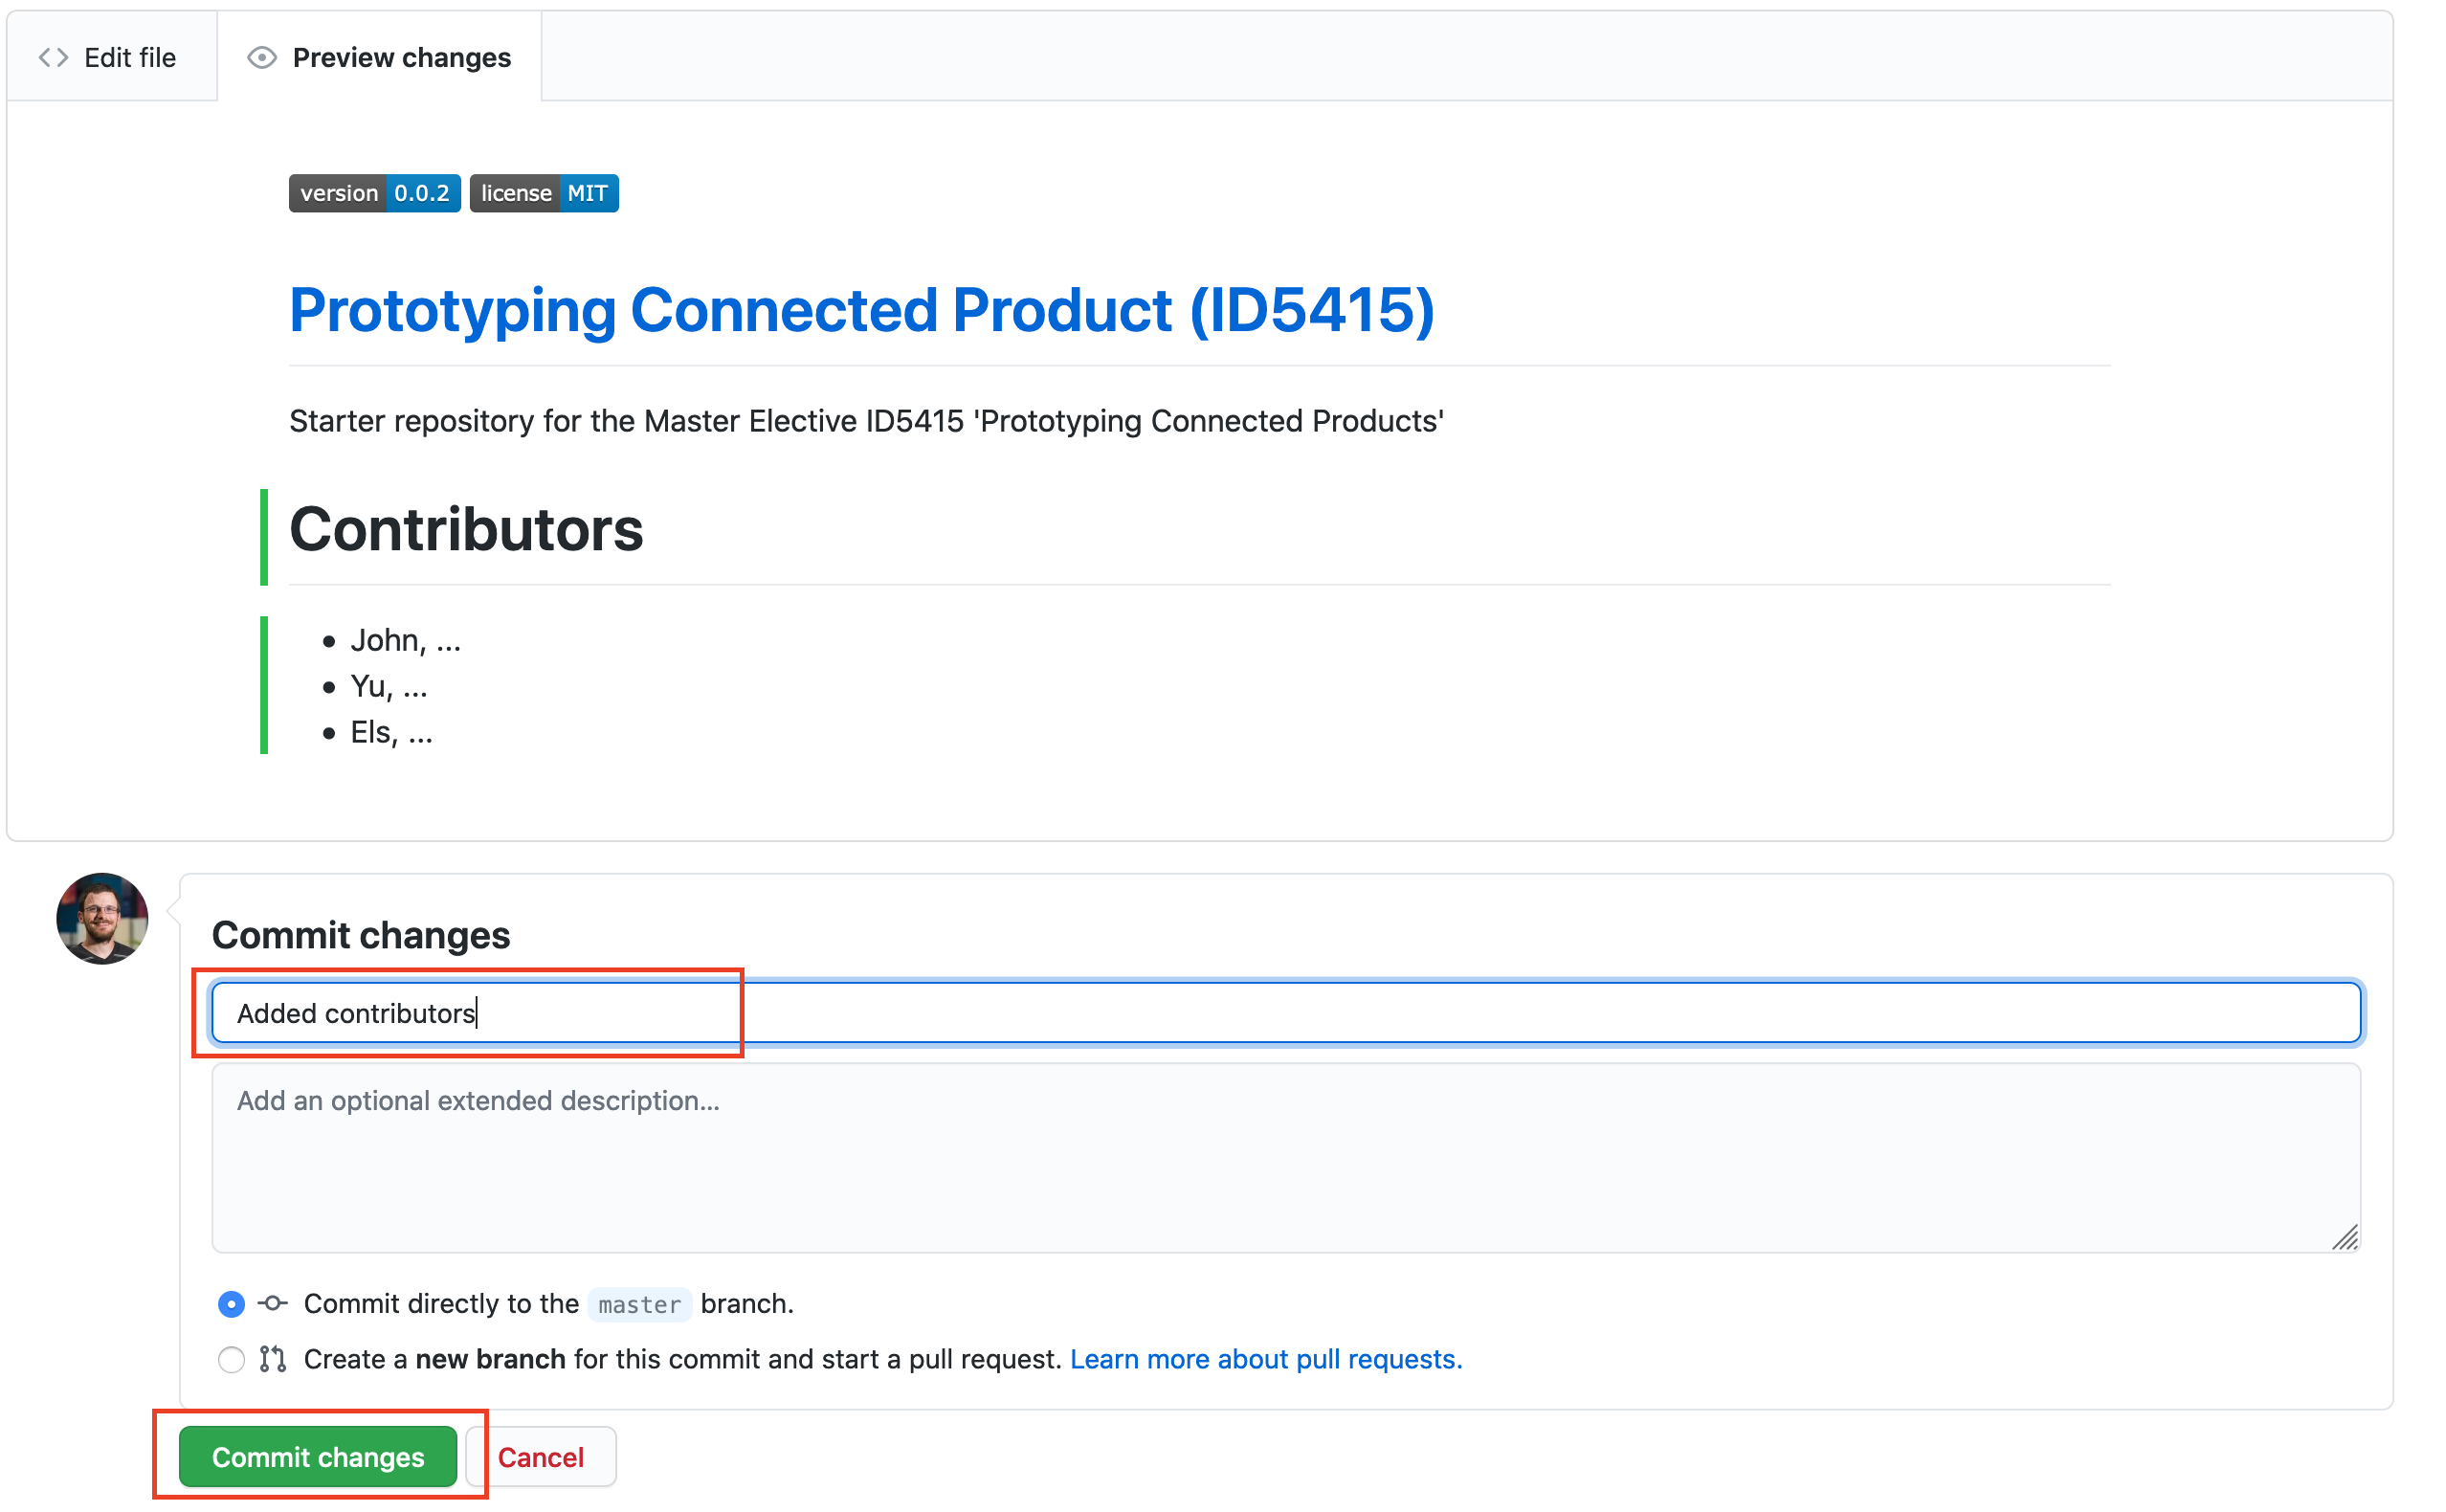
You can preview your changes, add a note on what you changed (e.g. ‘Added contributors’), then press the green button ‘Commit changes’ to save (more on this terminology in assignment 2).
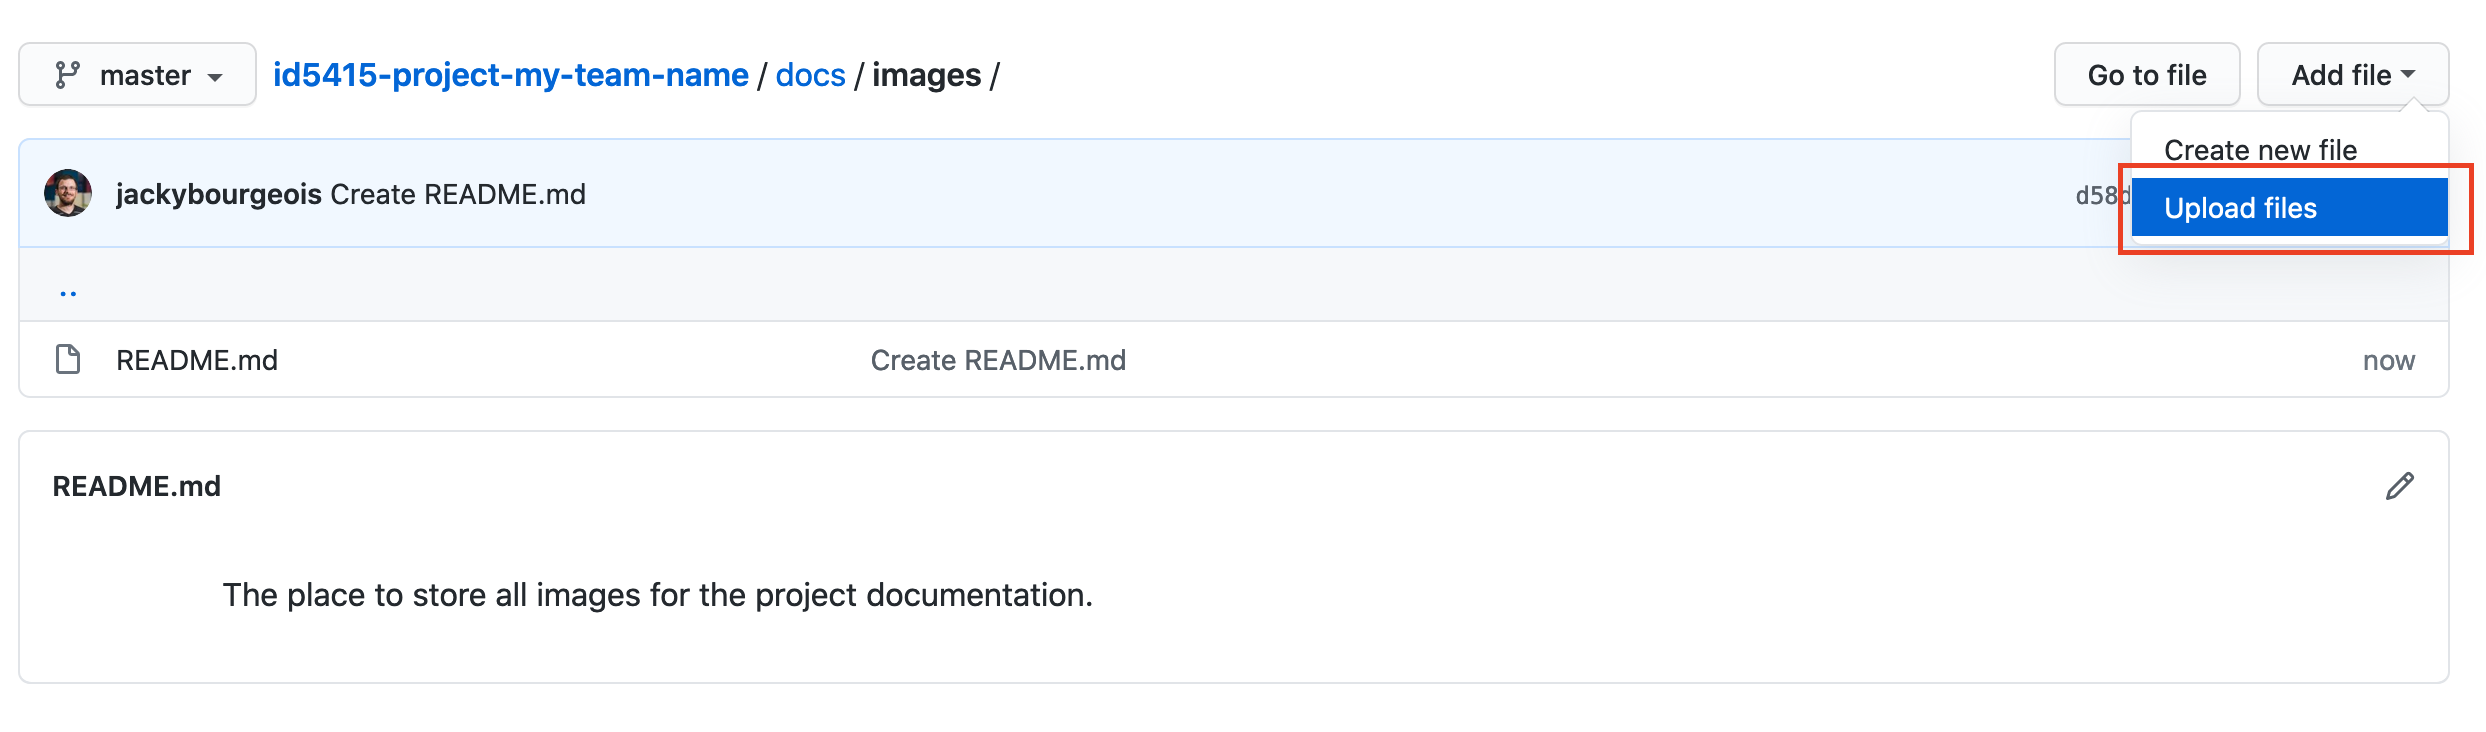
You can add tables, images, links and so on with similar tags. We now set an introduction image. Go back to your root directory (i.e. the highest directory of your repository)
Click on the ‘docs’ directory, then ‘images’ directory. Click on the drop-down menu Add File > Upload files.
Drag and drop your image. Once again, add a comment (e.g. ‘Banner for the project’) and press the green button ‘Commit changes’ to save (this can take a while).
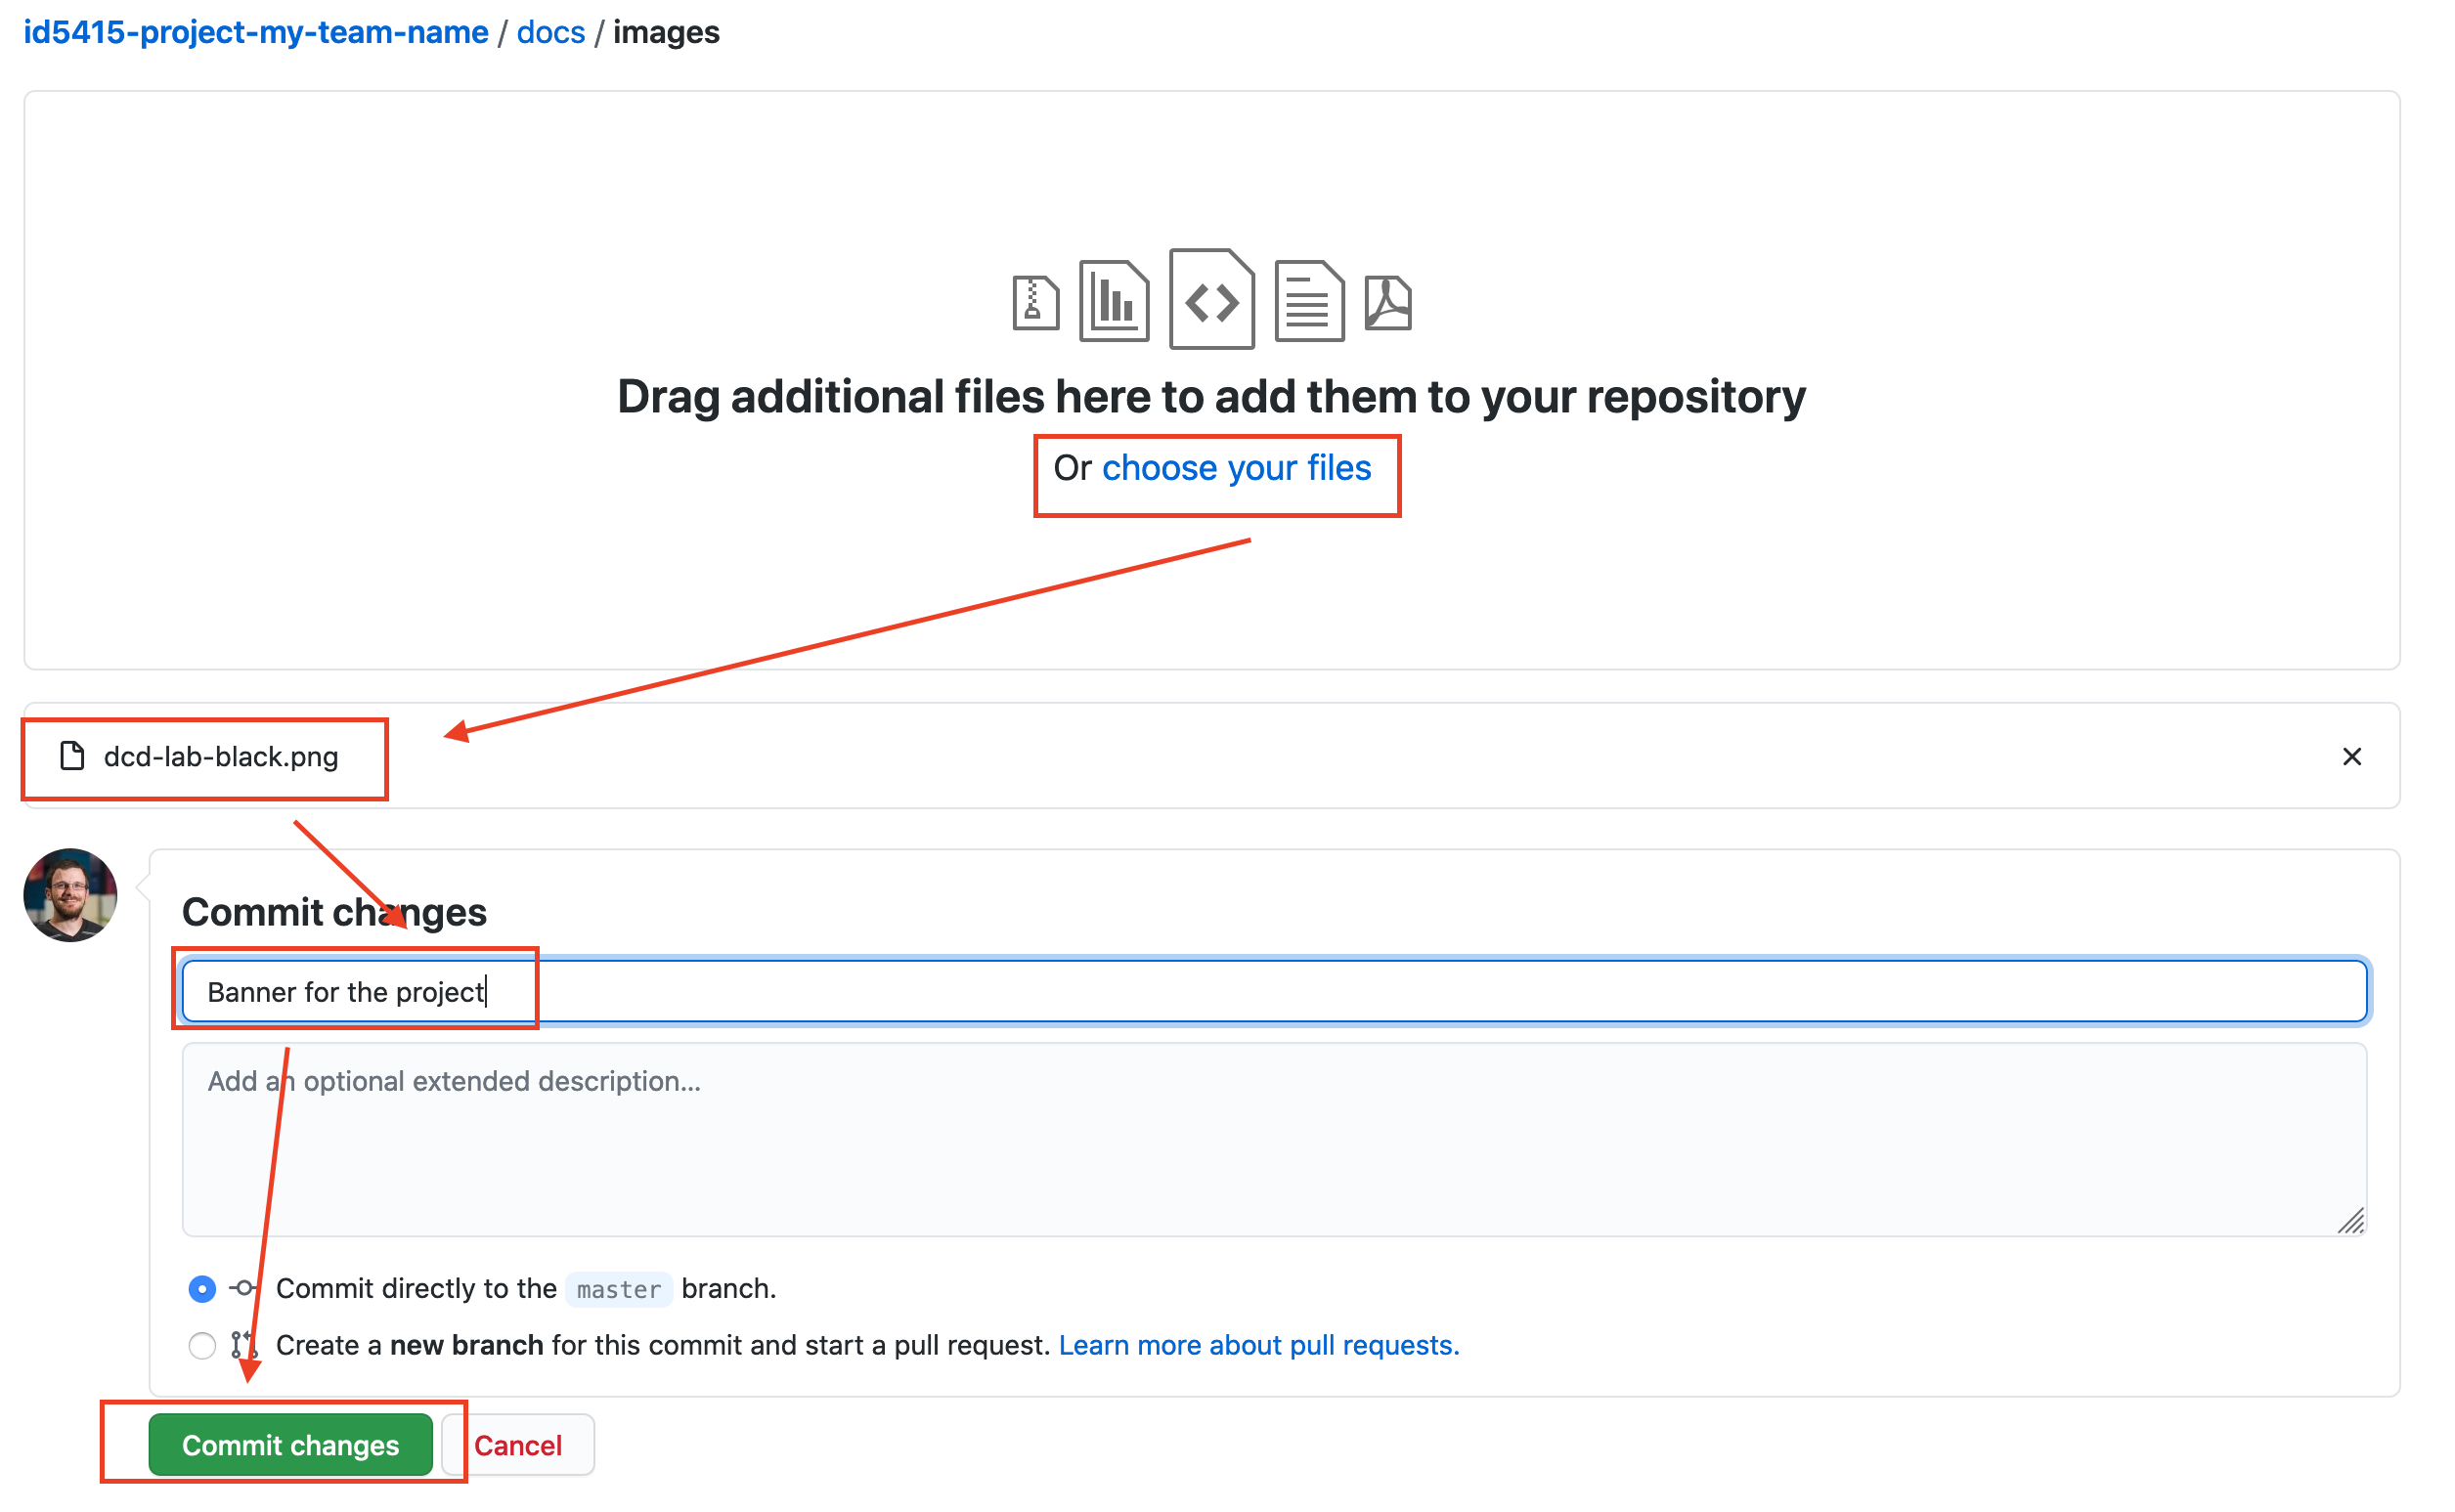
Back to your README.md, type in the following at the top of the file (replace dcd-lab-black.png by the name of your file):


A cheat sheet of Markdown can be found here
Task 1.3 Reporting a Lab Experiment
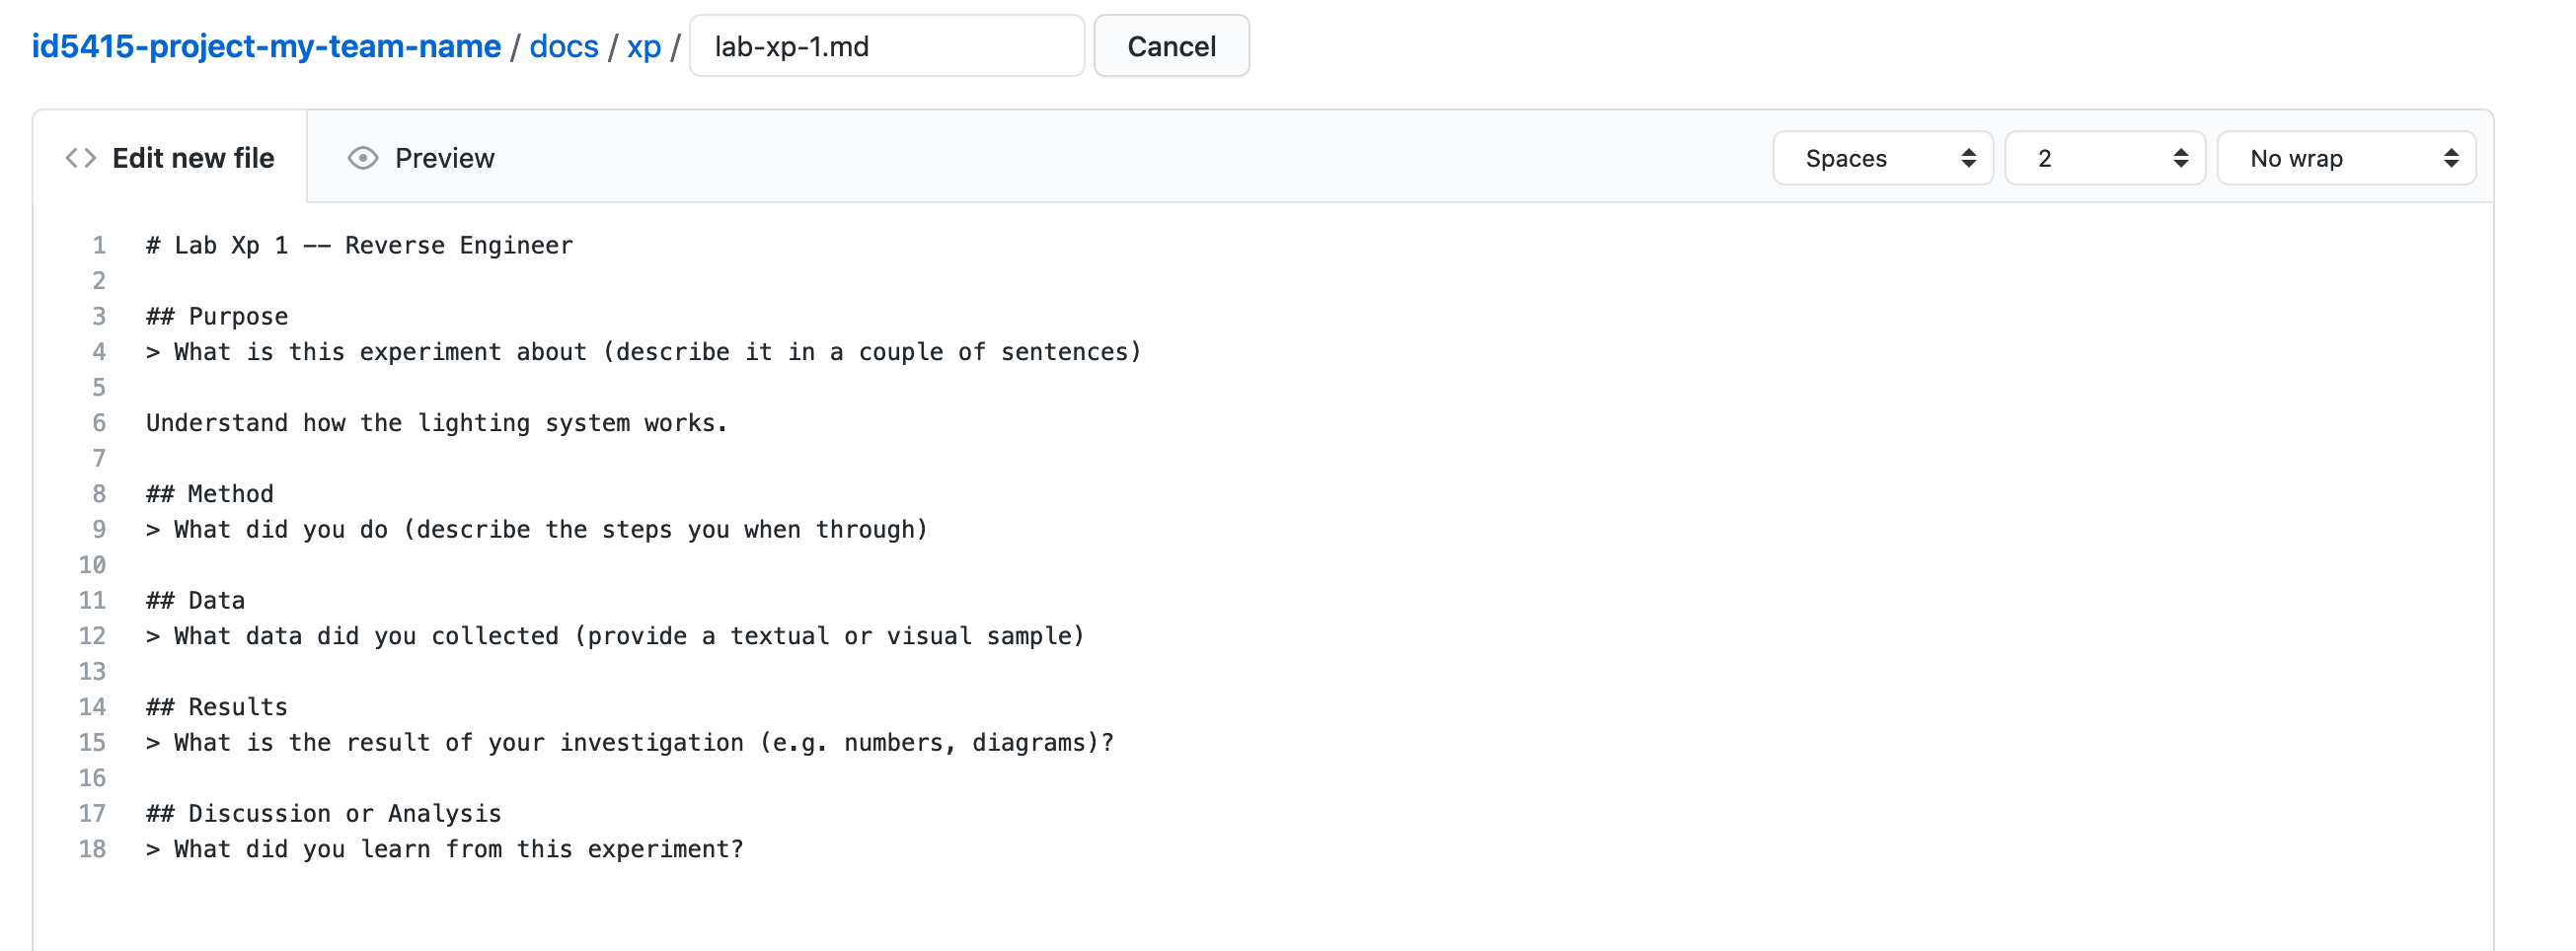
Throughout the course, you will report your lab experiment on GitHub, in the docs > xp directory. Let’s get started with the report of the first experiment. On GitHub, in the docs > xp directory, edit the file xp_template.md copy its content and paste it in a new file lab-xp-1.md.
What did we achieve?
- we have a GitHub repository, ready to report the first lab experiment
- we have some basics of formatting for reporting
Step 2: Identifying the IoT’s Technology Stack
In this step, you will start exploring two types of data: the logs generated by the hub to understand what is happening and the sensor data generated by the connected devices.
In the self-study material, we explored the IoT’s technology stack. Let’s identify the components of the 5 layers of this stack for our prototype.
Task 2.1: Report IoT Technology stack
As we have studied in our first self - study materials, try to describe the following questions:
- What are the device hardware components?
- What are the device software components?
- What are the communication components?
- What are the cloud platform components?
- What are the cloud application components?
In this exercise, do not hesitate to distinguish:
- what you know and how?
- What you assume. In this case, what are the possibilities and why do you make these assumptions?
Here is a starting point for information:
At this stage we do not need a very detailed diagram, following the IoT technology stack introduced in the self-study material is the right level: Daniel Elizalde
Report In your lab experiment report, describe this IoT stack with text and a diagram.
Step 3: Logs
It is common for software to generate logs so that the maintainers can monitor it and look for information when things go wrong. On the Raspberry Pi image that you have downloaded from Bucket, we installed Python script. Instead of looking a the code, that we do not understand yet, let’s look at the logs of these scripts.
Task 3.1 Find the Logs
Connect to the Raspberry Pi with ssh. As before, replace the square brackets with your information.
ssh [username]@[hostname.local or IP address]
After entering your password, we land in your Raspberry Pi’s home directory. The logs are commonly stored in the directory /var/log. Thus, we store the logs related to our platform in this directory, inside dcd (for Data-Centric Design). Let’s navigate to this directory with cd (change directory):
cd /var/log/dcd
What is in this directory? We list its content with ls (list):
ls
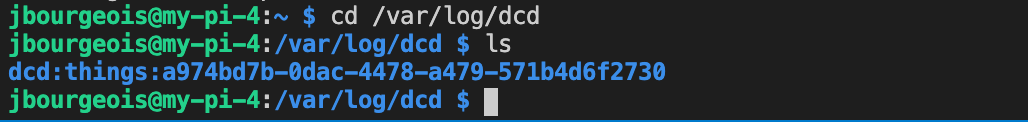
You should see one directory named after your Thing id (dcd:things:…). We now enter this directory with cd, replacing the square brackets with your Thing id as listed in the directory. As we do not want to spend time typing this long directory name, simply press the TAB key to auto-complete.
cd dcd[press TAB]
Task 3.2 Read the Logs
Use the ls command again to list the content of this directory.
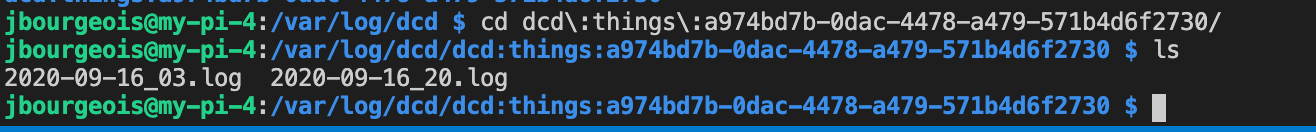
You should see files with names like 2020-08-24_16.log, which represent the date and the hour of the day (in this case August 24, 2020 at 16:00). Sorting log files by date is a common practice to retrieve them easily. Let’s open one of them with the command cat (read a file and show it in the Terminal). Replace the name of the file by a date that exist in your log folder. Again, use TAB to auto-complete the name.
cat 2020-08-24.log
Task 3.3: Downloading Logs
Depending on how long your Raspberry Pi has been running, this might print a very long number of lines. It is not always practical to browse through them in the Terminal. It is often convenient to have the ability to explore log files (or any data file) on your laptop.
Let’s achieve this with the scp command (s standing for ssh and cp standing for copying) to remotely copy log files from Pi into your local machine/laptop.
To do that first we have to leave our Raspberry Pi and come back to your computer. To leave the Raspberry Pi, type exit in the terminal and press enter. This will disconnect your ssh connection with pi and you will be back to your machine/laptop directory in terminal.
exit
Back on your computer, type in the following command, replacing the square brackets with your own username, hostname and thing id. Pressing ENTER, you will be prompt for the password of your Raspberry Pi, as you need to authenticate yourself before copying the files.
scp -r [username]@[hostname.local]:/var/log/dcd/[your thing id] ./backup_log
This command means that we copy from the remote directory of the Raspberry Pi containing the log of your thing into the local directory backup_log (in your current folder, on your computer). If the command succeed, you should see a directory backup_log in the left panel of VS Code, containing your the log files.
Task 3.4 Analyse the Logs
- Look at the first log file in time. It should contain some information about what happens when the Raspberry Pi start.
- Identify repeating patterns, these are most likely pieces of code running in loops
- Look for decision ‘The thing is connected to the Internet.’
Report On GitHub, in your lab experiment report, insert a snapshot of logs and write your interpretation of it. You might want to draw a simple flow chart to illustrate your understanding.
Step 4: Data Visualisation
In the previous step, the analysis of the logs should have highlighted that the Python script running on the Raspberry Pi sends data to your Thing’s digital twin on Bucket. To explore this data, we can connect to Grafana, a web application running on our server and capable (with your consent) to access and visualise your Things’ data.
Task 4.2 Connect to Grafana
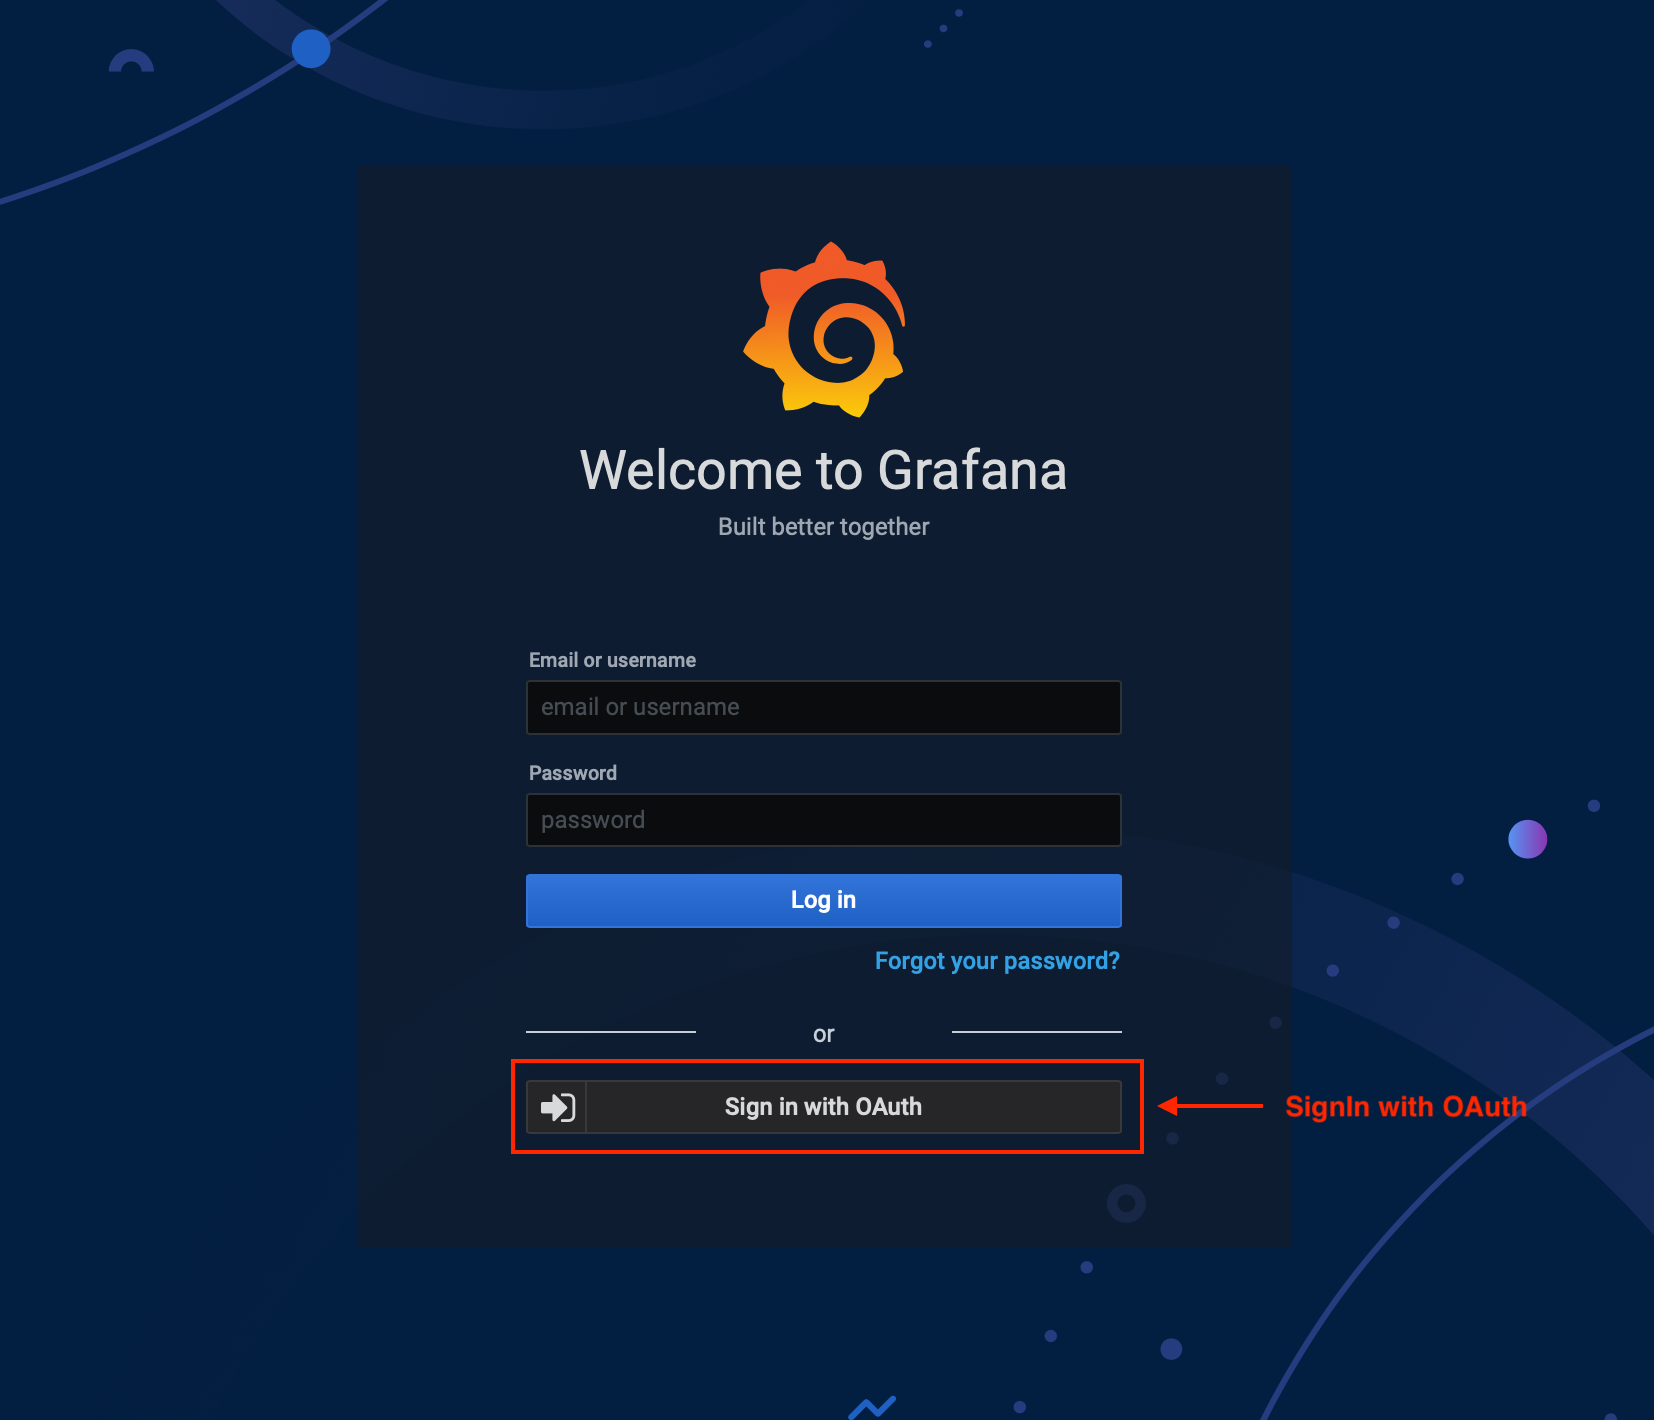
From your web browser, go to https://dwd.tudelft.nl/grafana. To login, click on the grey button ‘Sign in with OAuth’.
This way you get to sign in with your DCD Lab account.
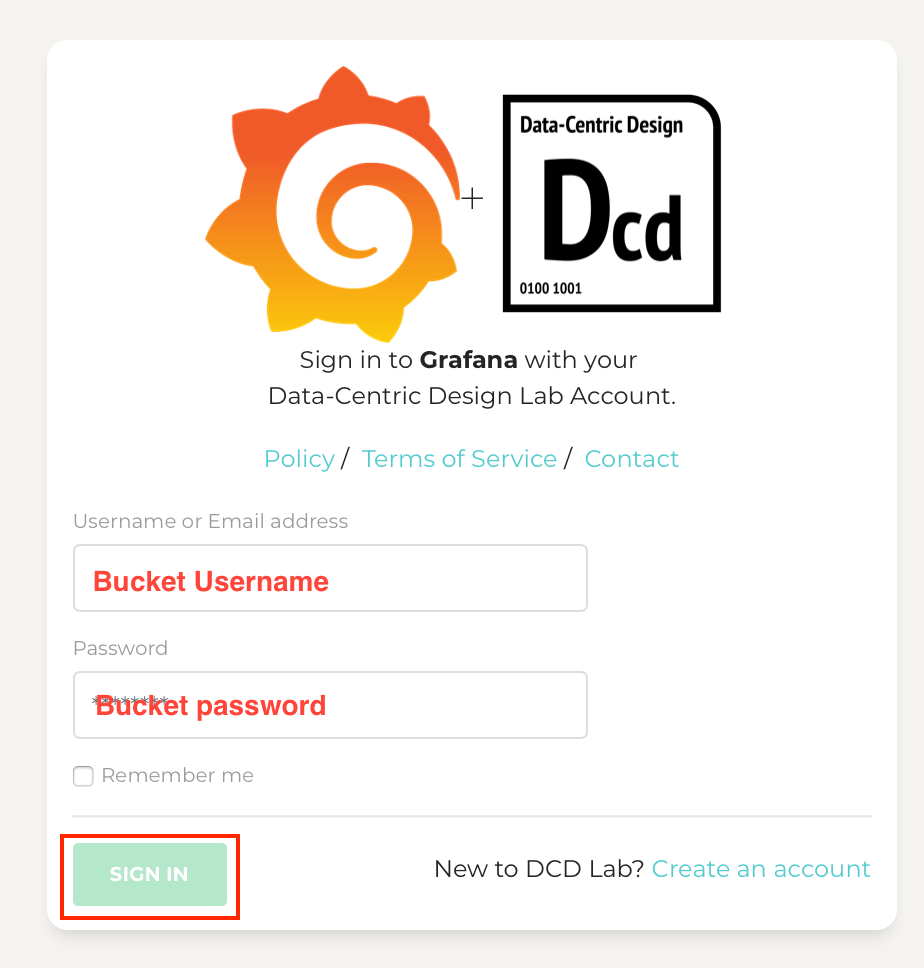
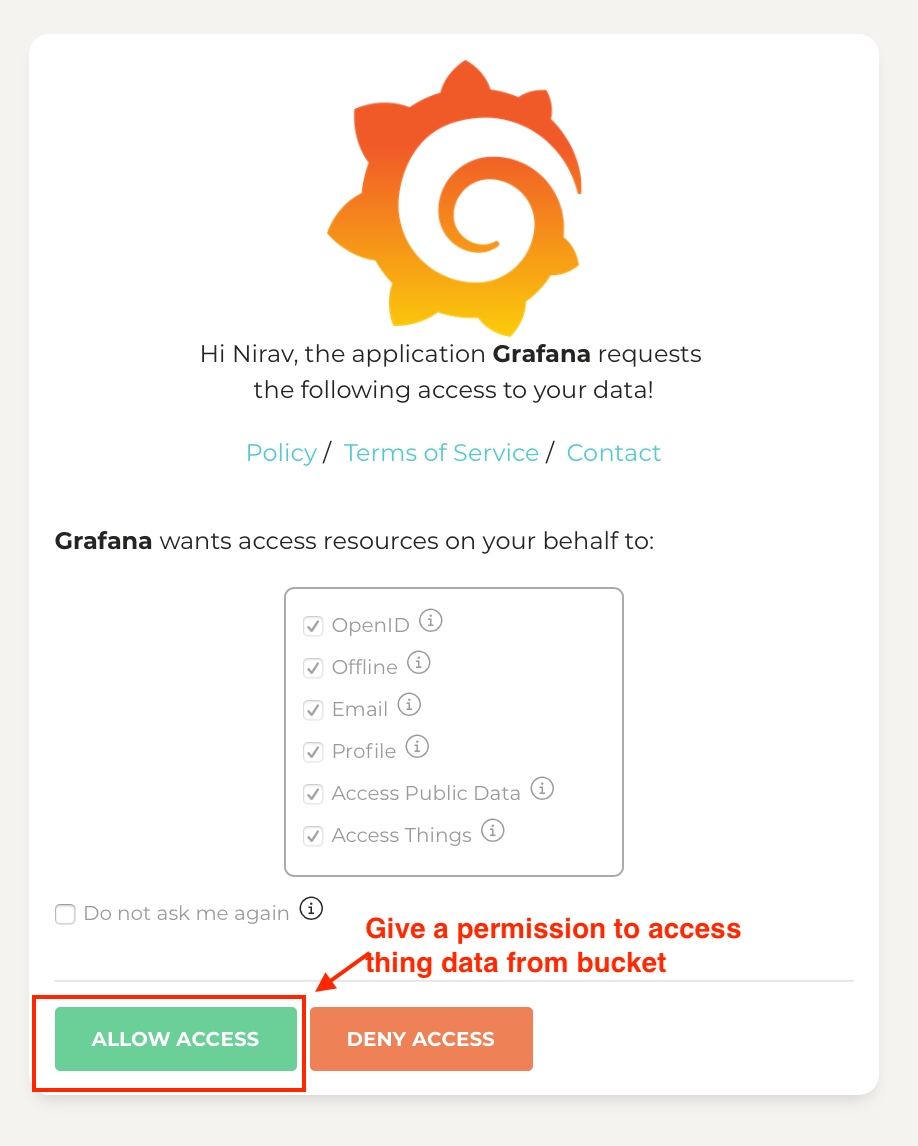
When pressing ‘Sign in’ for the first time, you will get prompted for the consent to let Grafana access your data. No worries, we are running this service ourself, your data is not leaving for any 3rd party company.
Task 4.3 Visualise your Thing Properties on Grafana
Once you have established a first login with Grafana, go back to Bucket. At the top of your Thing you should see a button ‘Visualise with Grafana’.
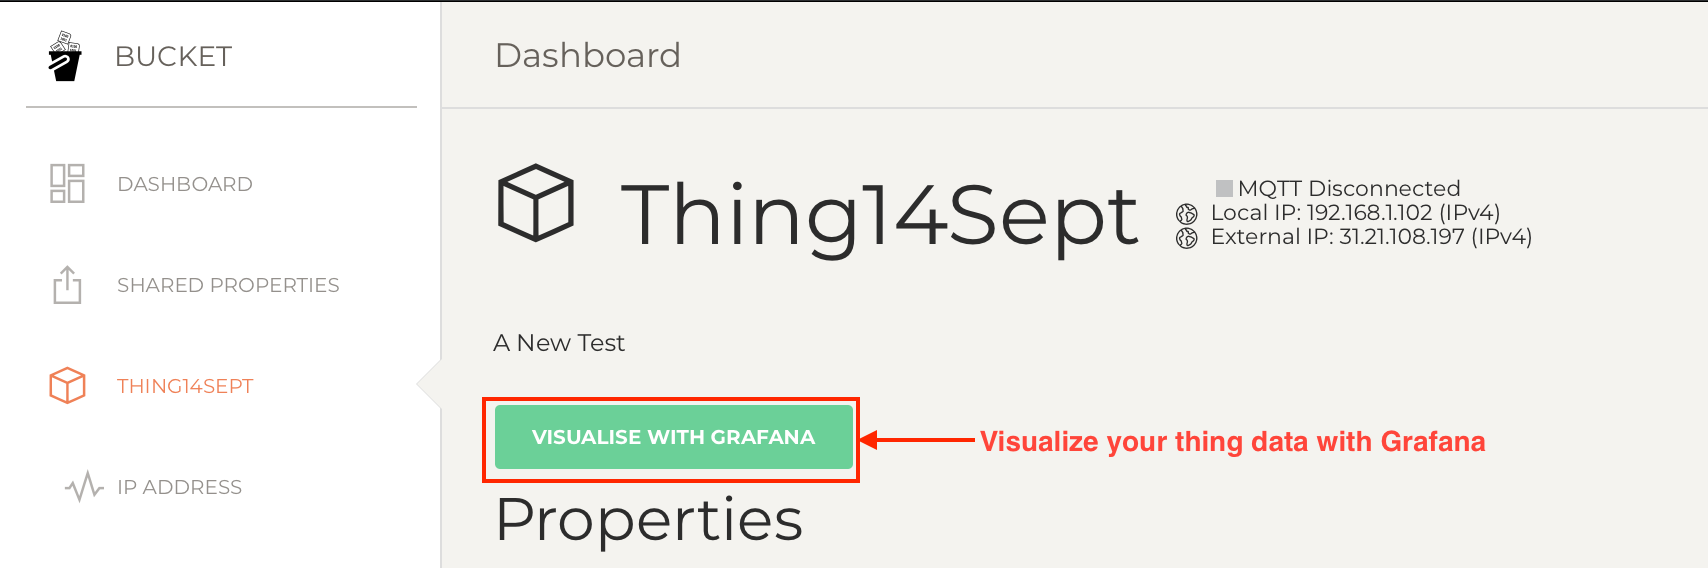
Clicking on this button, Bucket will automatically create a Grafana dashboard with the property of your Thing. If successful, you will be redirected to this dashboard.
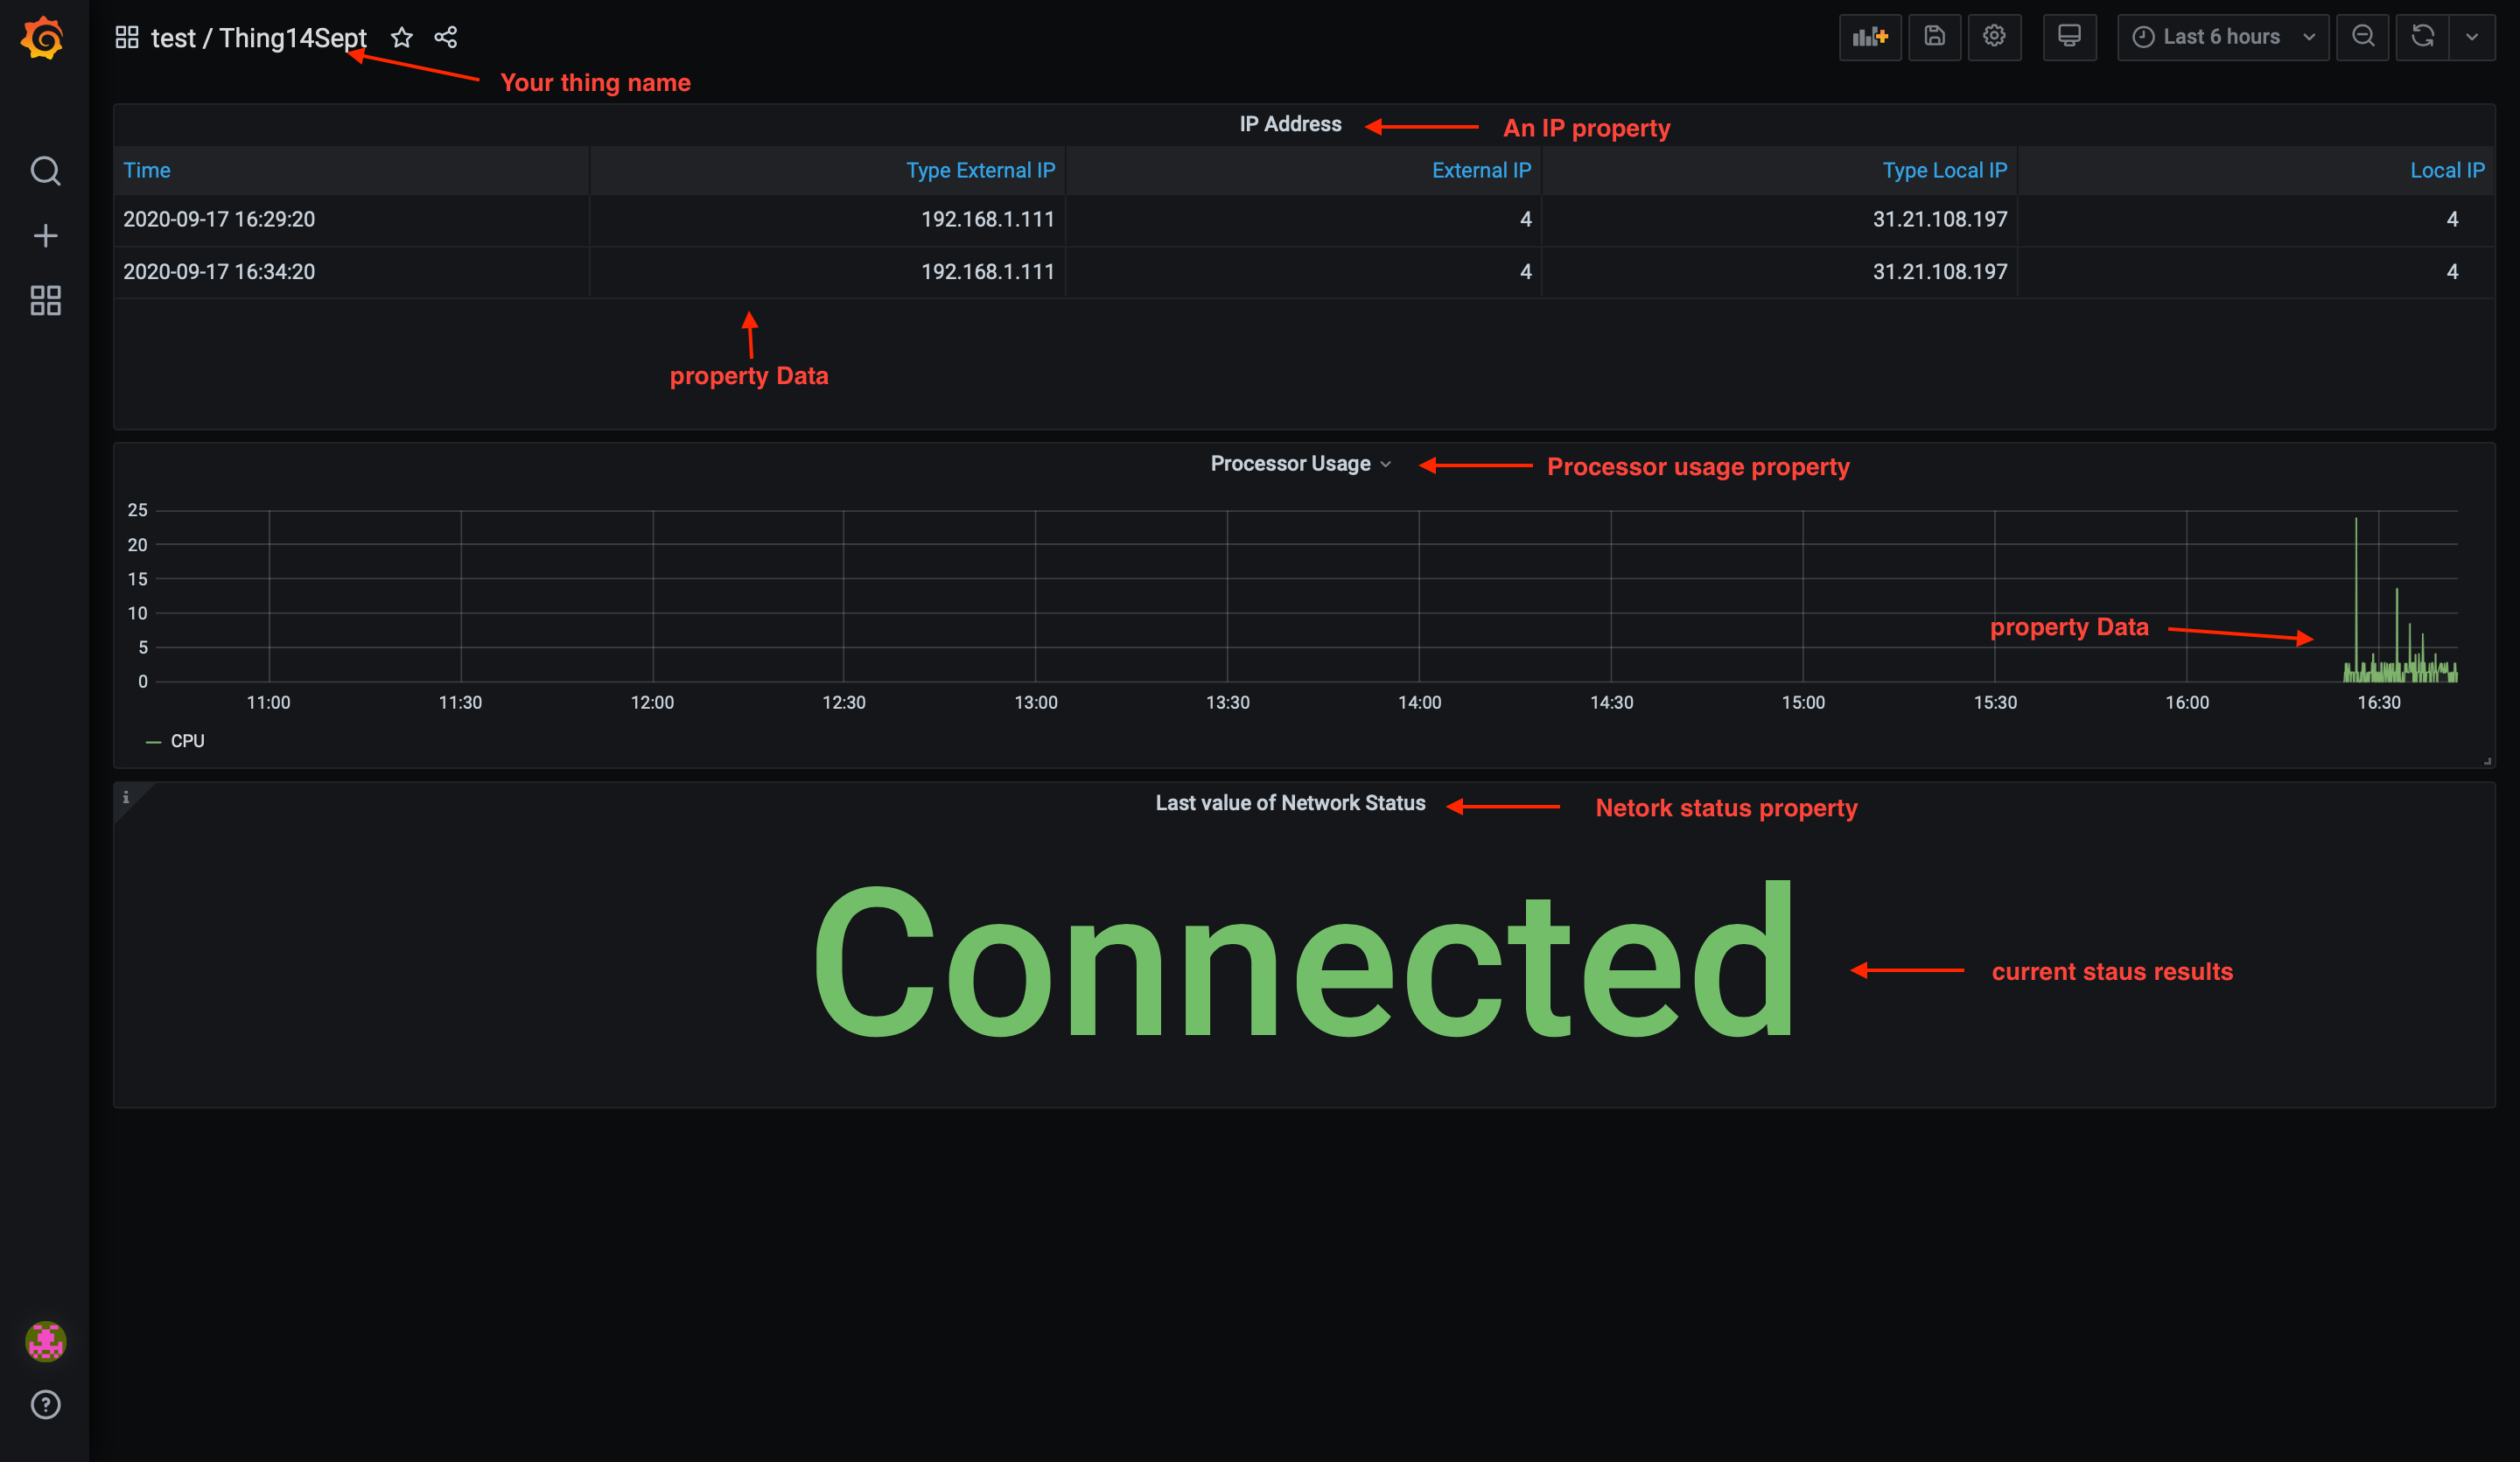
Report On GitHub, in your lab experiment report, describe your prototype dashboard with text and screenshots. What can we see and what these metrics mean?
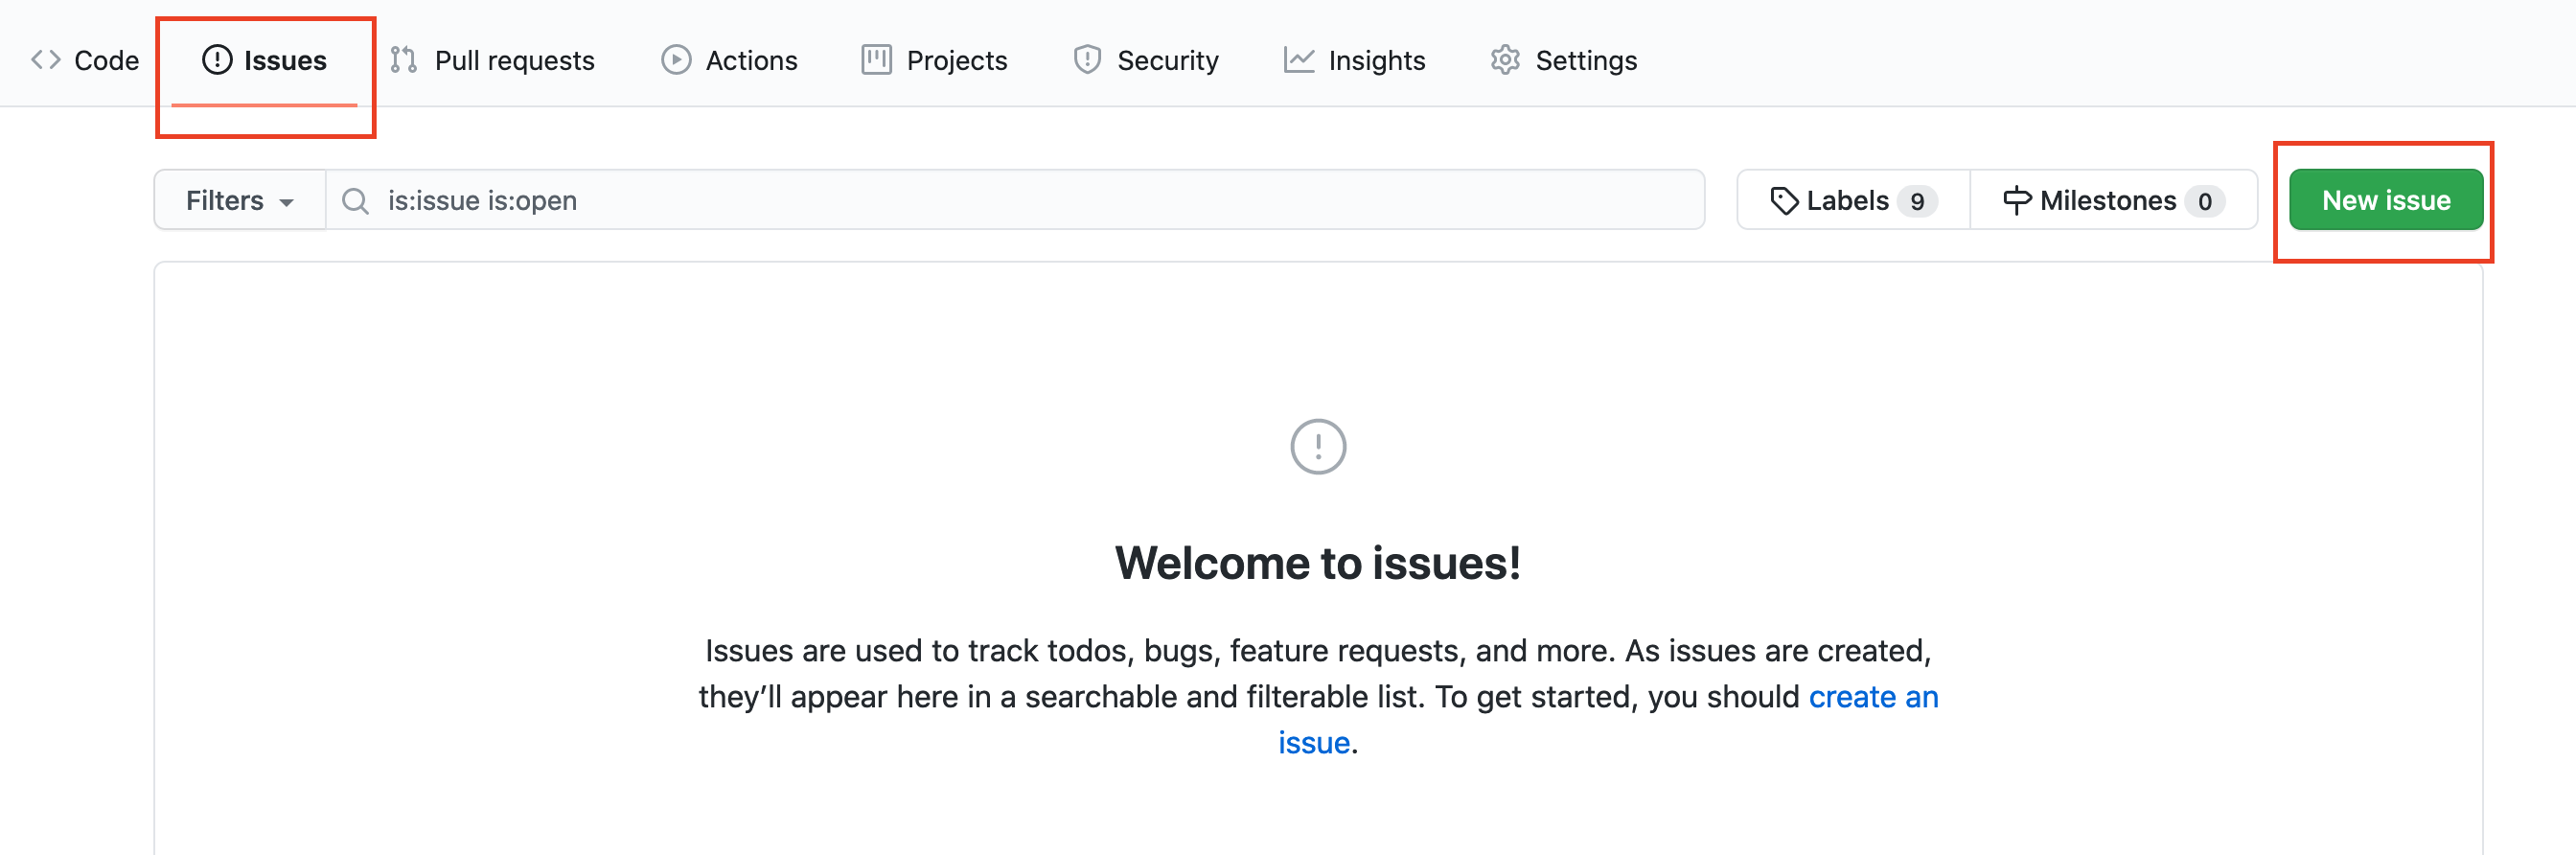
To conclude your lab experiment, open an issue. On GitHub, an issue is a discussion thread. In our case, we want to open a discussion space related to the first lab XP. This will be a sign to coaches that you consider being done with it so that they can go through it for feedback.
On GitHub, open an issue by clicking on the tab Issue.
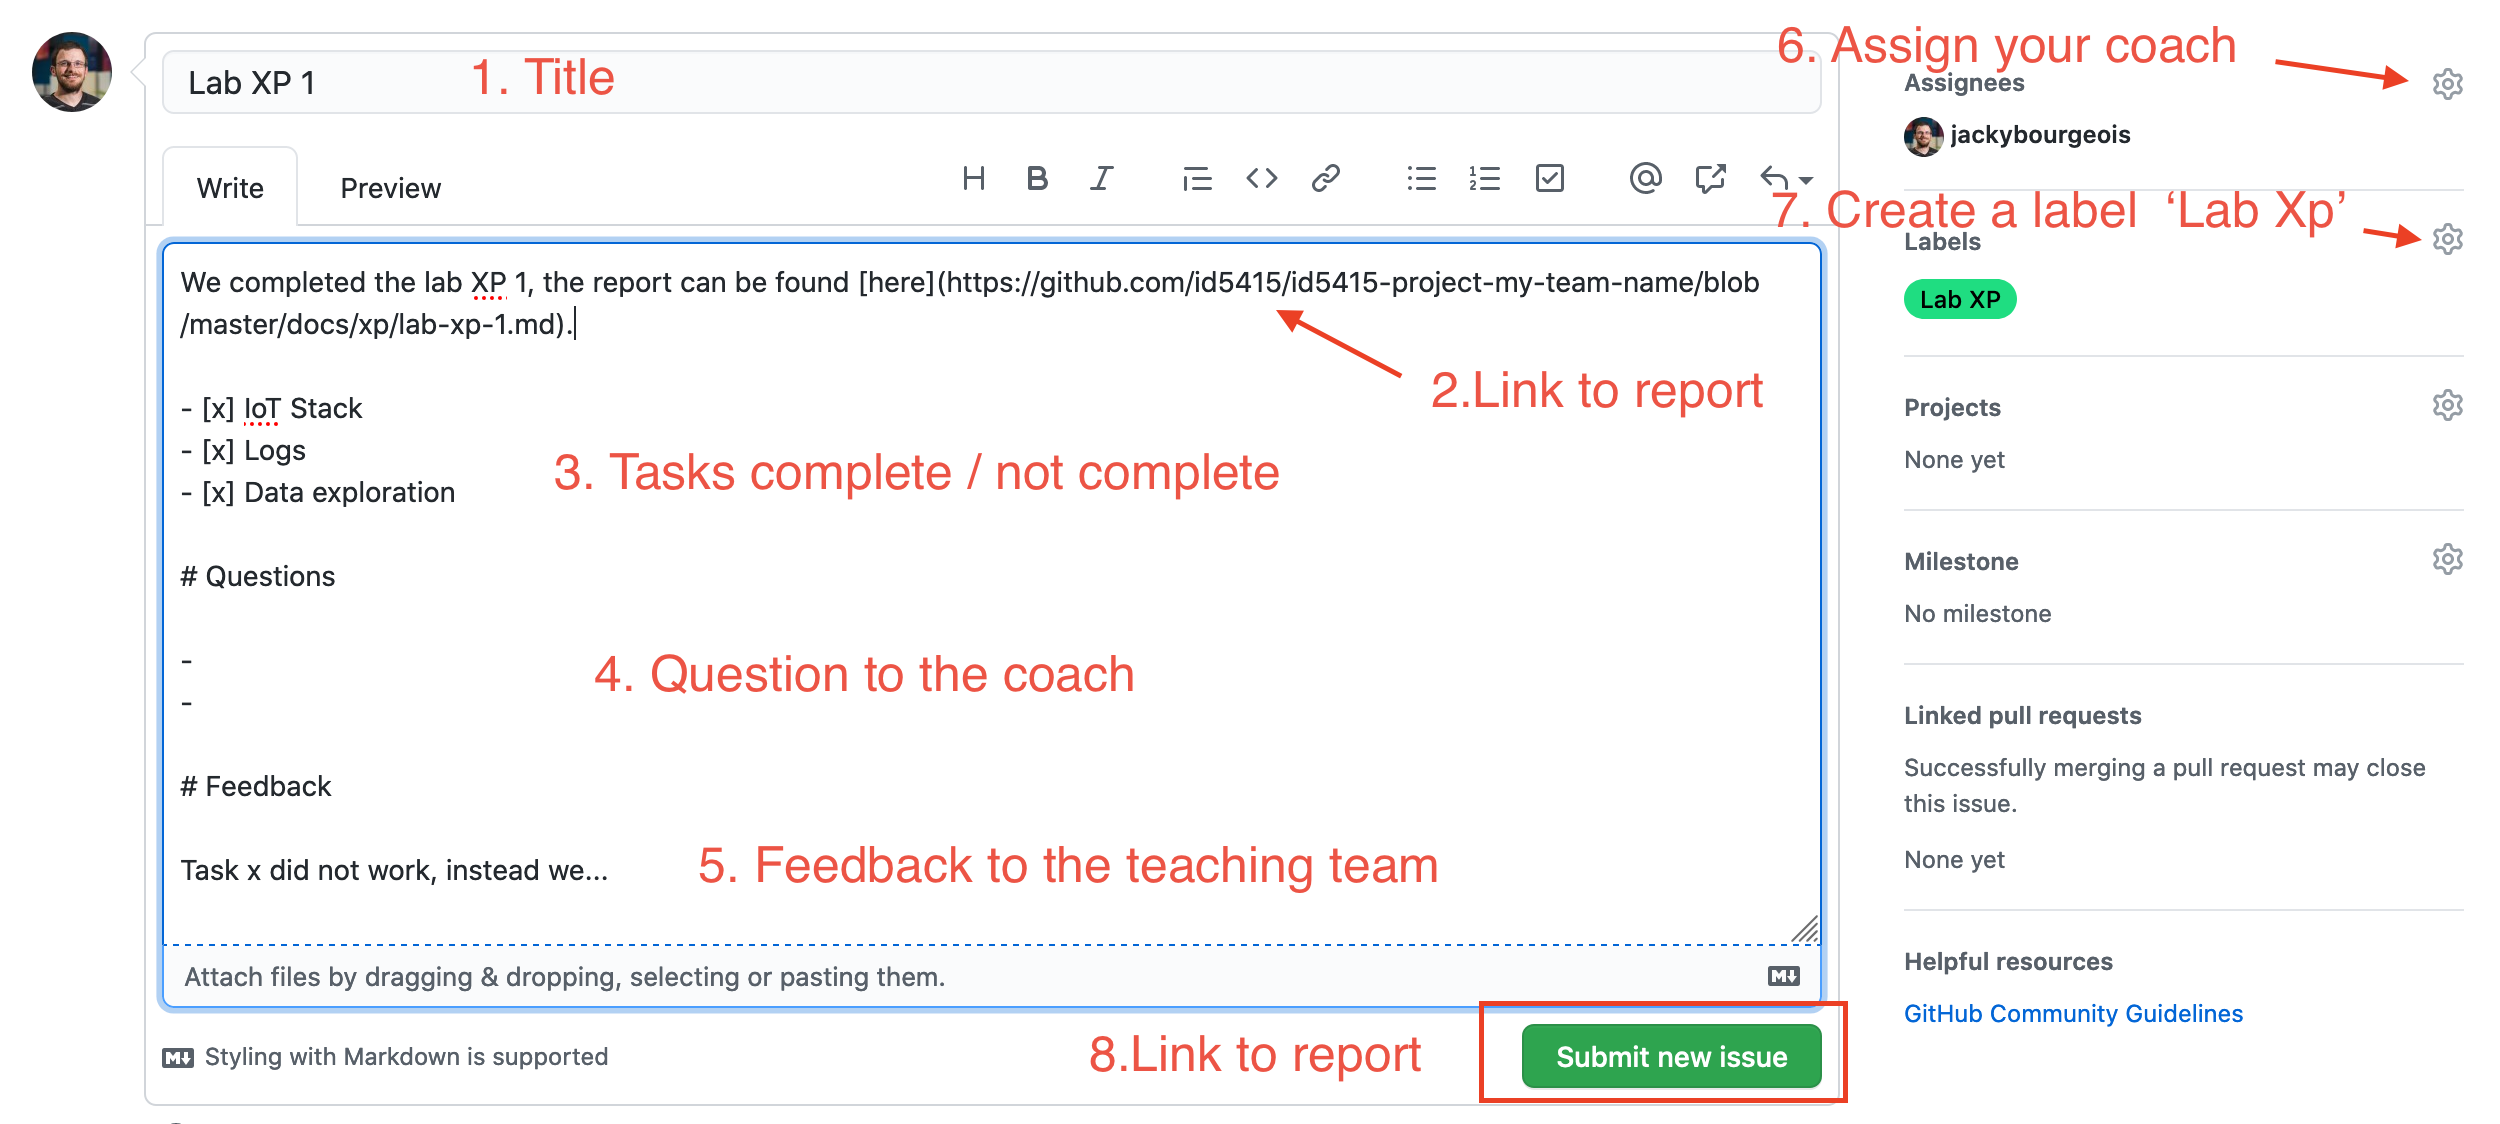
Like your lab XP report, you can use all Markdown tags to format your text with headings, links, lists and so on. In your issue, we expect the following elements:
- a title
- a link
- a list of tasks. In markdown you can use
- [ ]or- [x]for tick boxes - a question section
- a feedback session
- Assign your issue to your coach, to make it more visible to them
- Create a label ‘Lab Xp’, categorising this issue
Then, you can press the green button ‘Submit new issue’.
![]()
![]()
![]()
The European Commission's support for the production of this publication does not constitute an endorsement of the contents, which reflect the views only of the authors, and the Commission cannot be held responsible for any use which may be made of the information contained therein.