In this assignment, we will design an analytics dashboard for our prototype of Good Night Lamp. We will make an inventory of data collected throughout the course for our prototype as well as for the whole classroom. We will establish what information is missing, which would need to be gathered in future iterations.
Step 1 Share data with the class
By default, Bucket makes properties’ data only available to the owner of Things and the Things themselves. In Module 5, you created a group to enable your teammates’ Things to subscribe (i.e. to access) your lightbulb’s status via MQTT.
We will use the same process to share properties with the whole classroom. For this, the course coordinator created a group id5415-20-q1.
In this step, you can make the data of your Things available to the students and teachers taking part in this edition of the course. This data will be linked to the name and id of your Thing, as well as your Bucket username. It is your personal decision to share this data which as no impact on your assessment for the course nor your ability to proceed in this assignment. Whether you go forwards with sharing none, one or several properties’ data, please document your decision process in the lab experiment.
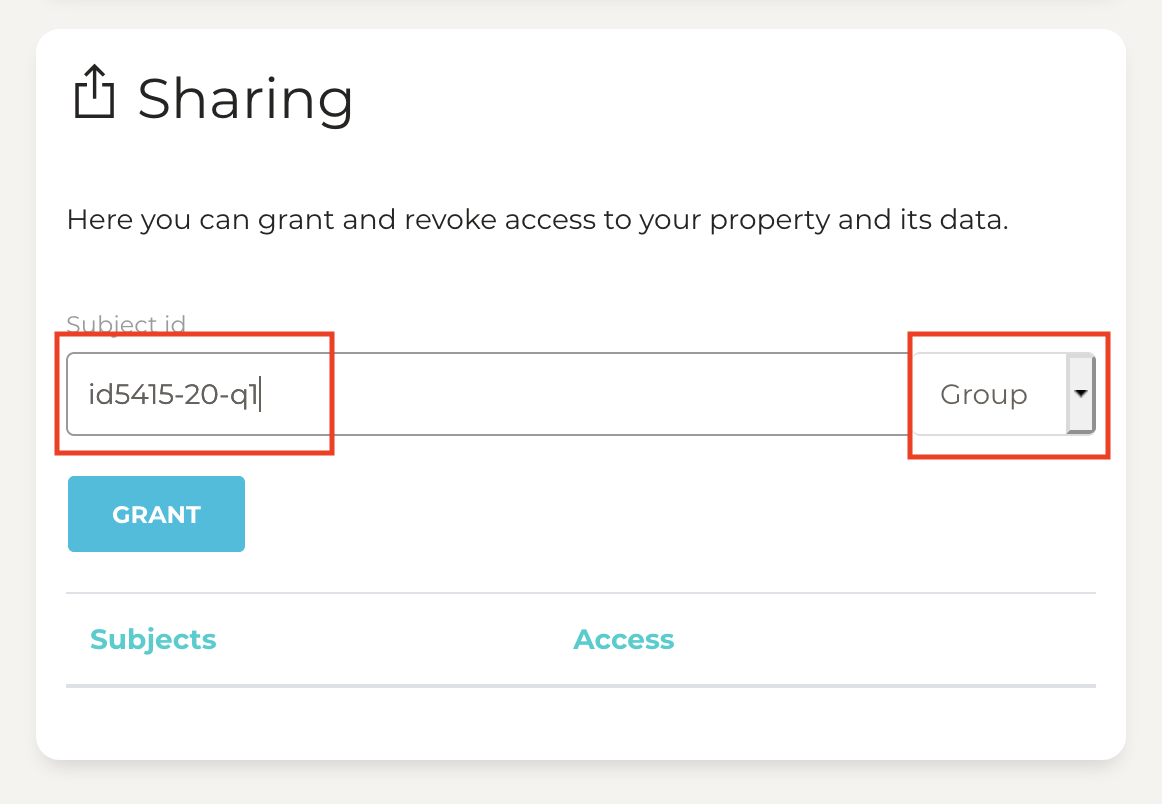
On Bucket, go to your Thing properties (e.g. the lightbulb status of your Lightbulb Thing). In the ‘Sharing’ card, fill in the name of the group id5415-20-q1 and select ‘Group’ in the drop-down menu. Finally, by clicking on the blue button ‘Grant’, you will grant access to this property to the member of the group.
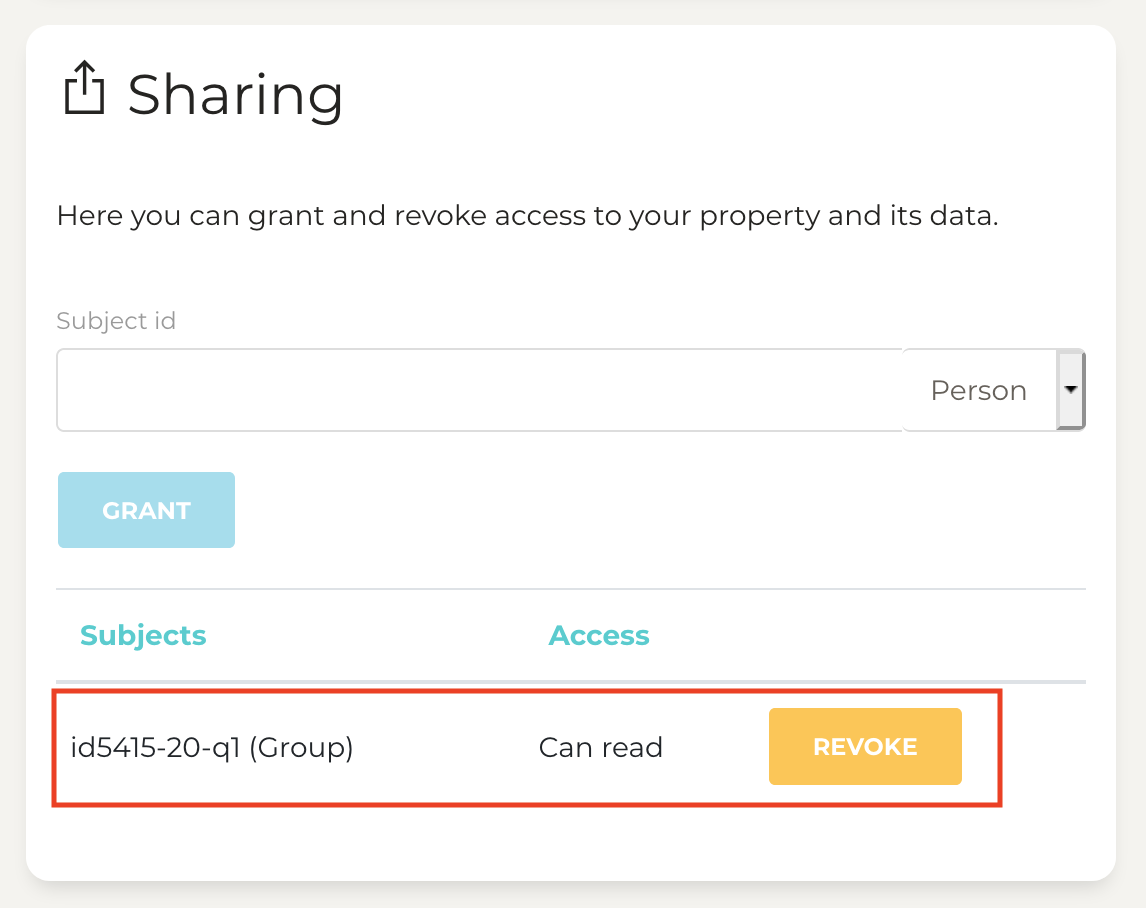
The result should look as follows, your property now listing a granted access to the group.
Feel free to revoke the access at any time by clicking on the orange button Revoke
You can repeat this step for all the properties we want to share, such as the three sensors (light, temperature and humidity), the Processor Usage of the Raspberry Pi and the network status. You might also have text properties if you collected events.
Let’s keep the IP address private as it can reveal more sensitive information.
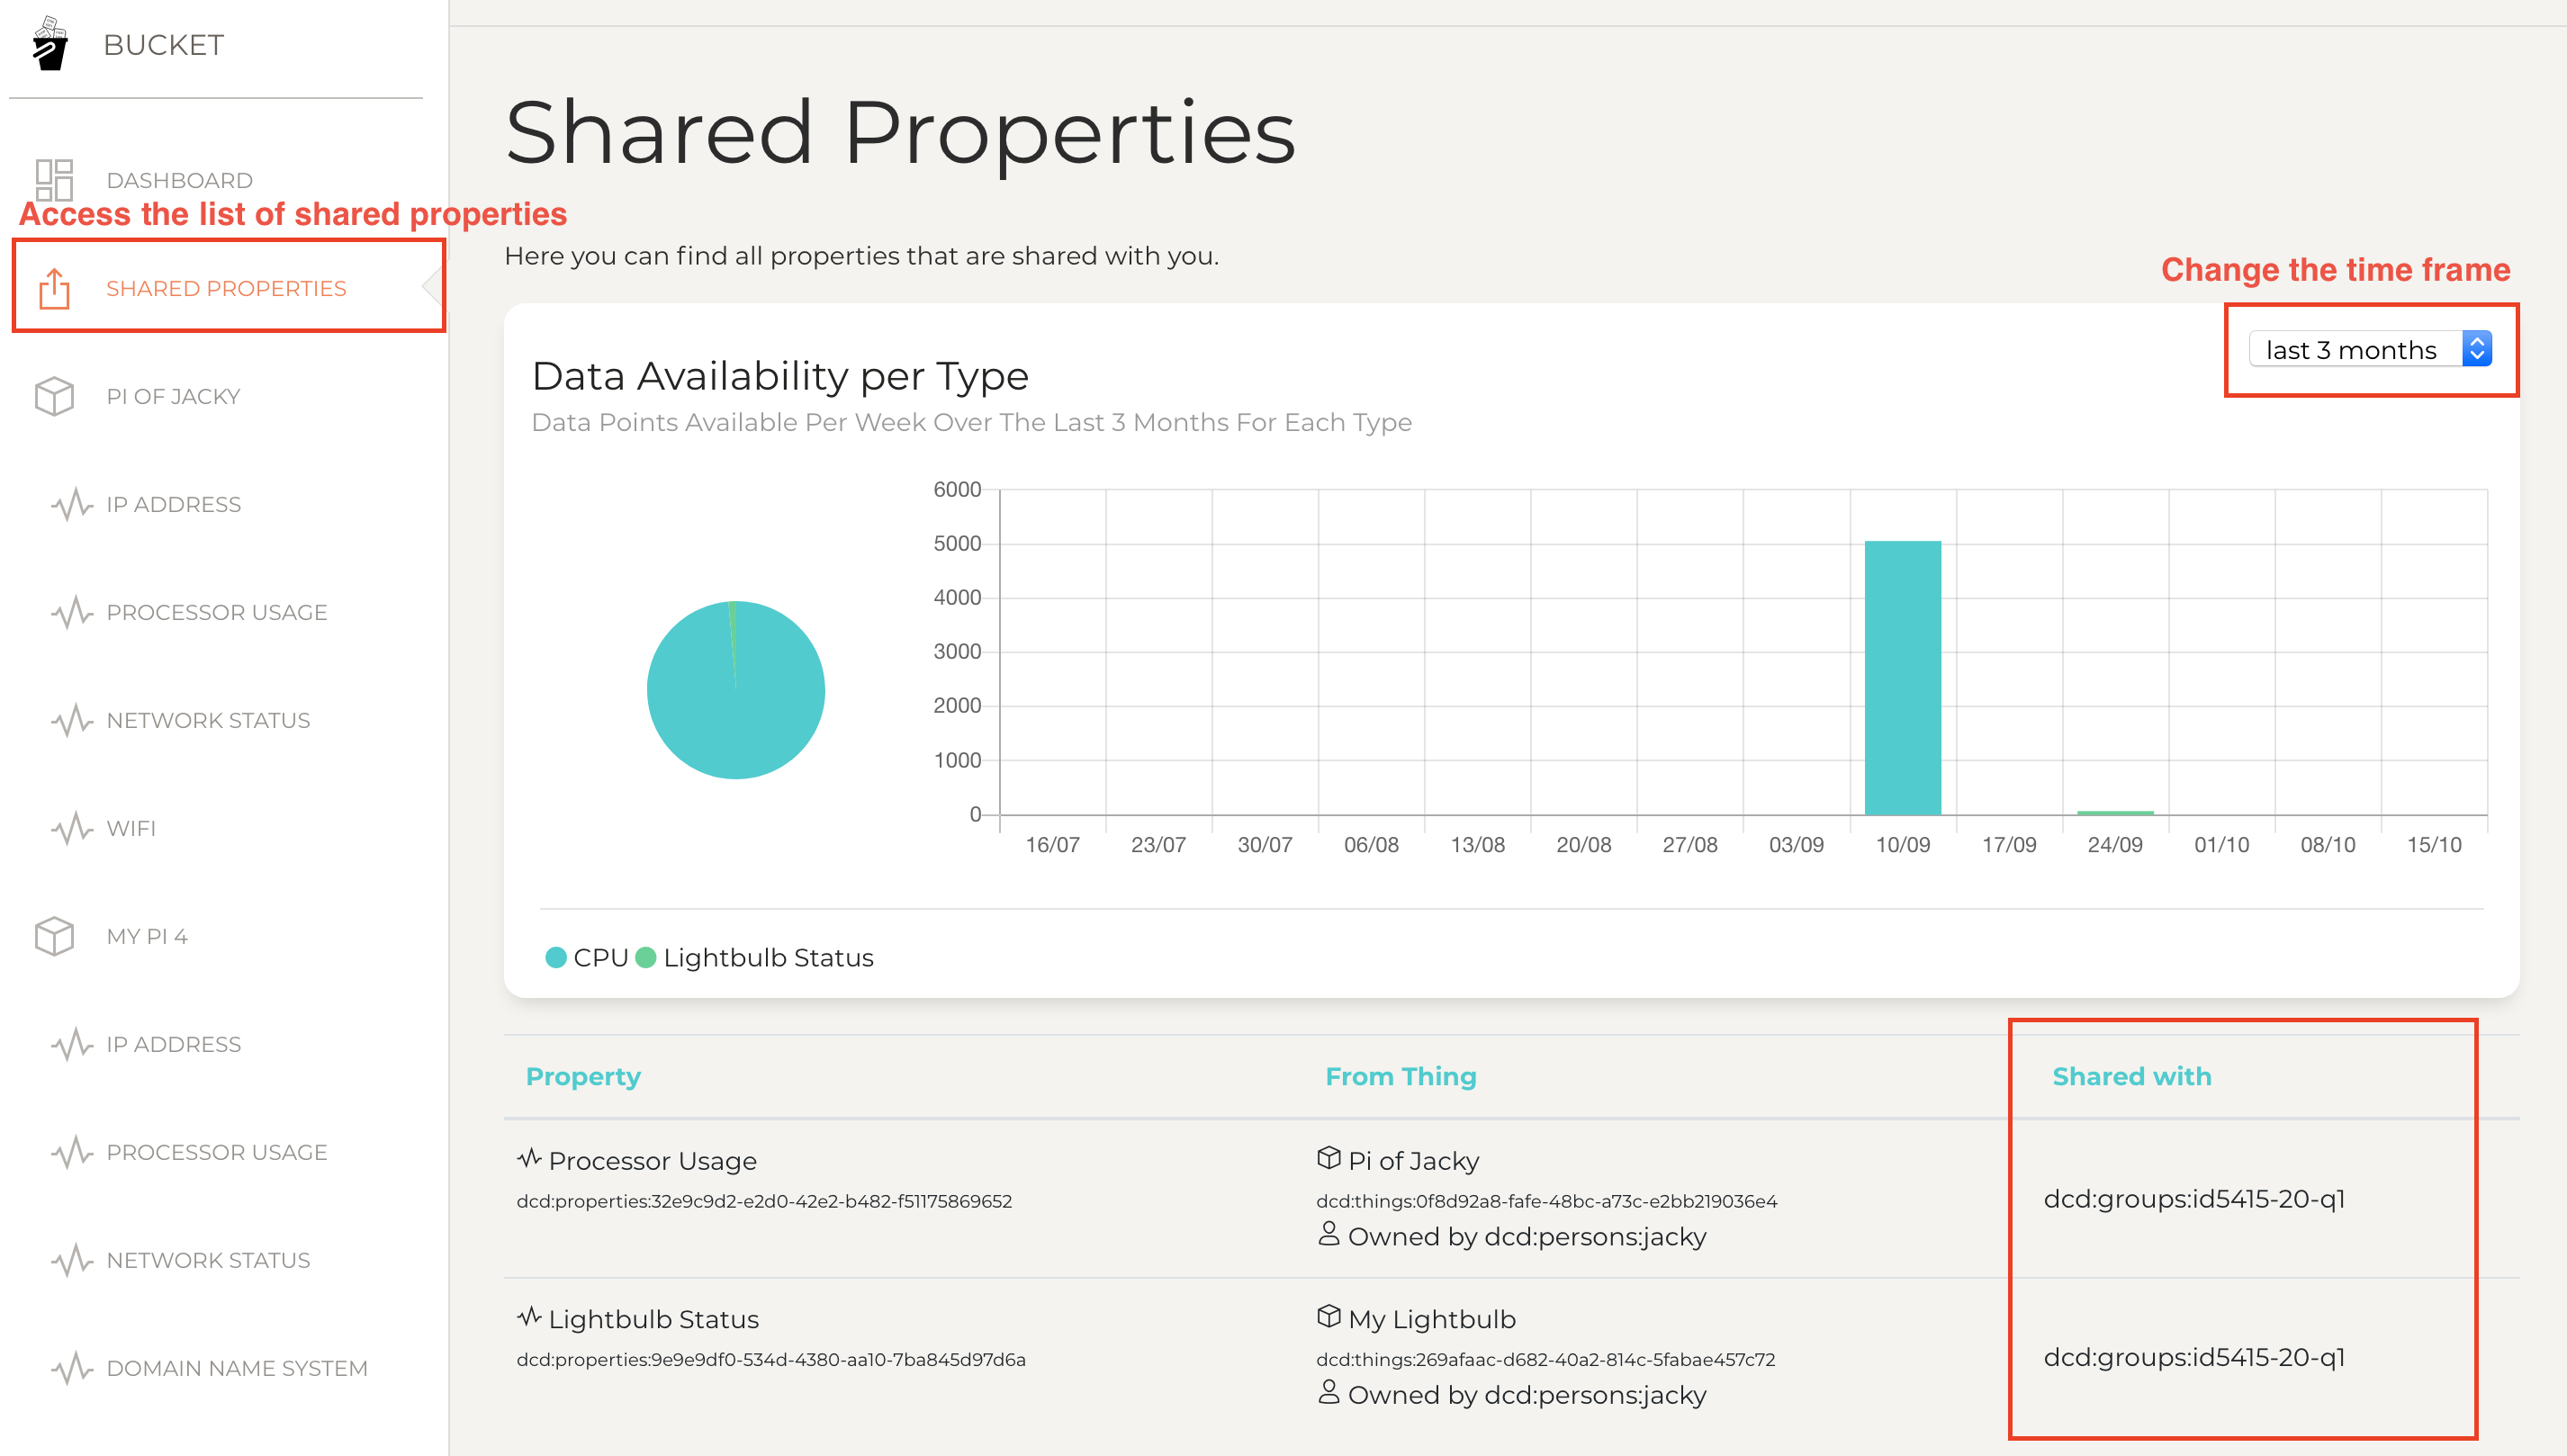
In the left panel of Bucket, navigate to ‘Shared properties’. In this page, you should see an expanding list of shared properties belonging to your peer students and course teachers. We will look at these chart in Step 4, leaving all students who want the time to share their properties.
If you do not see any shared properties, you are probably not yet a member of the group for the current edition of the course (id5415-20-q1). Please contact the course coordinator via MS Teams with your Bucket username, so that you can be added to the classroom group.
Step 2 Design an Analytics Dashboard
Let’s step back from our code and prototype and think about the Good Night Lamp concept. In this step, we want to design an analytics dashboard for this connected product.
For this exercise, do not limit yourself to what we implemented throughout the course. Instead, imagine the ideal Good Night Lamp and envision how you would verify your design goal. We want to be able to answer the following question: we deliver the intended impact?
For this, you need to define:
- The goal(s) to achieve, the impact we desire with our product
- The signals to capture product and user behaviours
- The metrics to track to measure your goals.
You will recognise here the Goals-Signals-Metrics process from the self-study material by Kerry Rodden.
Once you defined your metrics, draw a dashboard on paper or with your favourite drawing software. Think about where each metric should be placed, which visualisation element to use (e.g. table, pie chart, bar chart) and how you expect the data to look like.
In your lab experiment report, describe the design process of your dashboard, including a description of your goals, signals and metrics, their place on the dashboard and the expected shape of the data.
Step 3 Make a Data Inventory
We have now an ideal product/prototype analytics dashboard. We can dive into what we have collected, individually and as a classroom, to check what we have already and what we are missing. Let’s be modest. We are in the first iterations of our prototype, with limited testing.
Task 1 Look at individual properties
We can use the Bucket dashboard as well as Grafana to make an inventory of the collected data from our Things: the Raspberry Pi and the Lightbulb. The Bucket dashboard provides us with an overview of data we collected so far while Grafana shows the time-series of each property.
In your lab experiment report, create a table listing all data sources (such as emitted events & other properties). For eacj source, give the number of data points and when data was collected (collection period).
Now, with a rough indication of what is available to you, you can, vis-a-vis the good night lamp concept, and indeed other connected products, we can start to think what kinds of trends we can retrieve and analyse.
Make a list of possible trends/analytics (at least 3 more than the examples) that we can analyse using components of our table (step 1)
Possible examples:
- What is the sensor with the most variance? (what do sensors that exhibit extremely low variance of range of values indicate?)
- What are the main periods of activity of our prototypes over a day, a week, and the entire period?
- what are the most dominant events triggered by the system? Is it constant over time?
- Are the temperatures/light values consistent with day/night cycles? - why?
- When are the peaks of activity of your various sensors? Are they related to each other?
- Are there any consistent time patterns in device detections using the network (during the day, during the week)?
- What are other questions that you think of while looking at your data across the course period?
We can also connect this exploration to our experience throughout the course. Indeed, we were the one operating the prototype. Thus we can seek for the ‘why’ that emerges along the ‘what/when/where’ of these questions. We will contrast this ability in the next Task with data from others.
In your lab experiment report, document your answers and screenshots. Reflect on the gap to fill to enable the dashboard you designed in Step 2. What could be done to the prototypes to fill this gap.
Task 2 Look at properties across the classroom
To look at the fleet of prototypes across the classroom, we can go back to the Bucket page ‘Shared Properties’ (visited in Step 1). You should now see the list of properties shared by students for this edition of the course.
- How many properties do you have access to, per type?
- How many data point do you have access to in total? per type?
- What insights can we extract from the Pie chart?
- What insights can we extract from the bar chart?
What hypotheses can you draw from the data? A probable example could be ‘Students test their prototypes on Mondays and Fridays’. Maybe you can hypothesise more unexpected behaviours? In contrast with the previous task, we now ‘hypothesise’. The data give us an account of what happened but we were not operating the prototypes of others. It is important to always highlight our confidence in the conclusion we draw and what motivate these conclusions.
In your lab experiment report, document your answers with text and screenshots. Reflect on the gap to fill to enable the dashboard you designed in Step 2. What could be done to the prototypes to fill this gap.
![]()
![]()
![]()
The European Commission's support for the production of this publication does not constitute an endorsement of the contents, which reflect the views only of the authors, and the Commission cannot be held responsible for any use which may be made of the information contained therein.